
Market participants are experiencing a sense of relief as macroeconomic pressures diminish, and Bitcoin’s price is steadily approaching significant resistance levels following a notable recovery from its recent lows.
Daily Chart (D1): Macro Outlook – Positive Yet Not a Clear Uptrend
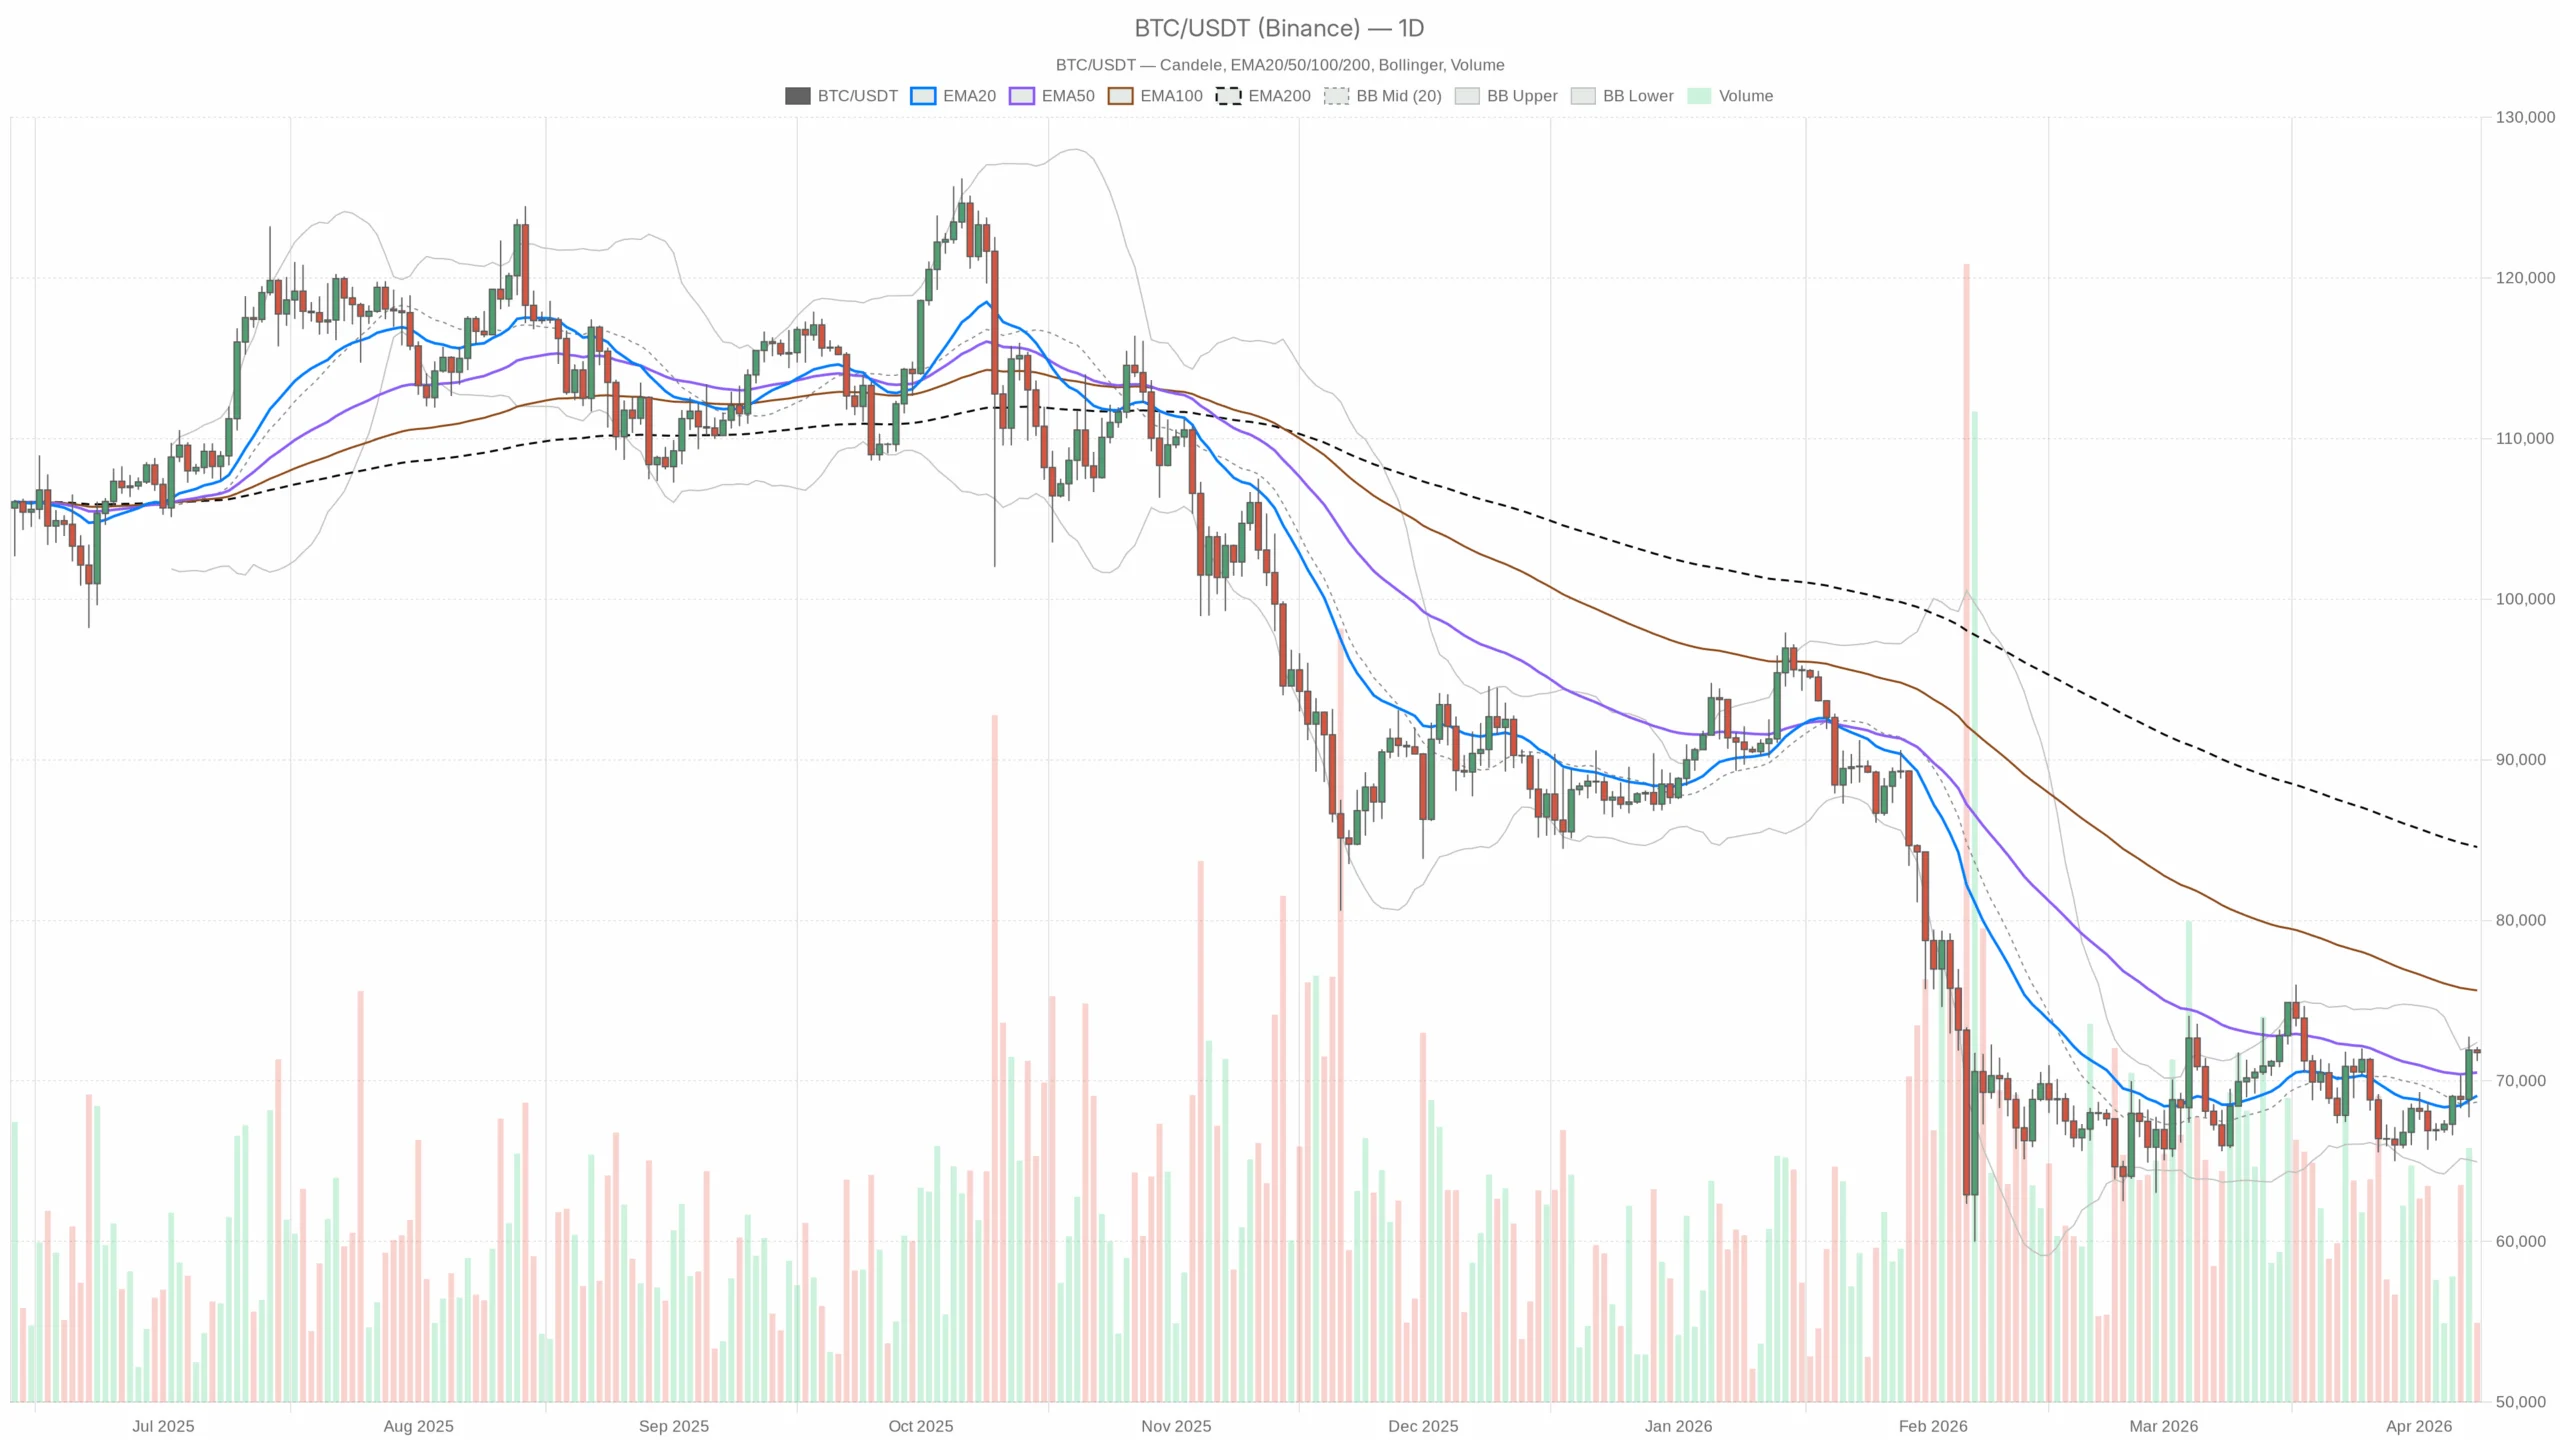
Currently priced at approximately $71,760, Bitcoin has reached a three-week high. This increase follows news regarding a potential ceasefire between the US and Iran that alleviated macroeconomic anxieties and boosted risk assets. This situation exemplifies a typical relief rally: as fears subside in the broader market, cryptocurrencies have already been significantly impacted by prior sell-offs.
An intriguing aspect of this moment is the divergence between market sentiment and actual pricing. The crypto fear & greed index remains in Extreme Fear (17), while $BTC approaches the upper Bollinger Band on its daily chart. The overall market capitalization has increased by around 3.6% within 24 hours alongside heightened trading volumes. Price movements indicate that risk appetite is returning; however, positioning and sentiment suggest that many traders remain skeptical.
The prevailing scenario on the daily timeframe leans slightly bullish but lacks characteristics of an ideal trending market. We find ourselves in a recovery phase with upward momentum while still being contained within an overarching corrective structure characterized by flat long-term trends.
Trend Structure: EMAs
– Current Price: $71,760
– EMA 20: $69,078
– EMA 50: $70,521
– EMA 200: $84,564
Bitcoin trades above both the 20-day and 50-day EMAs; notably, the former has recently crossed above the latter from below—indicative of short-term trend repair following previous corrections. Nevertheless, with the long-term EMA positioned significantly higher at around $84,564 compared to current prices suggests we are still below previous high zones without entering into sustained bullish territory yet.
The takeaway here is that while short- to medium-term trends appear to be improving upwardly; longer-term moving averages indicate we are still emerging from deeper corrections rather than advancing into uncharted territory.
Momentum Analysis via RSI
– RSI 14 (Daily): 58.6
The daily RSI hovers in high-50s territory—comfortably above neutral yet not overextended—indicating that momentum has shifted back towards bulls again although there remains room for further movement before it becomes excessively stretched out.
This suggests buyers maintain control on this timeframe but currently reflects more sustainable growth rather than impulsive spikes for now.
Momentum Analysis via MACD
– MACD line :32 .9
– Signal line : -450 .8
– Histogram : +483 .7
The MACD line surged past its signal counterpart accompanied by an expansive positive histogram—a sign of aggressive upside momentum emerging after prior weakness.The considerable spread indicates sharp reversals likely driven by short-covering along with rapid responses to macro developments.
The conclusion here shows strong bullish signals across daily metrics; however when such stretches occur it often leads either sideways consolidation or minor pullbacks instead of continuous advances.
Volatility & ; Price Location Using Bollinger Bands And ATR
– Midpoint Of Bollinger Bands:$68 ,682
– Upper Band:$72 ,408
– Lower Band:$64 ,956
– ATR14(Daily):$2 ,313
The price currently sits just beneath upper Bollinger band levels ($72 ,408).This indicates we’ve reached peak volatility post significant upward movement.Daily ATR stands at roughly$2 ,313 which means typical swings can range around three-to-three point five percent right now—not panic-inducing but elevated nonetheless.
:$BTC
Is Trading At Its Recent High-End Range In A Higher Volatility Environment Where Rallies Either Breakout With Follow Through Or Stall Into Mean Reversion .
<H4 Reference Levels:
Daily Pivot
-Pivot Point(PP):$71 ,704.
-R1:$72 ,167.
-S1:$71 ,
297.
<
P = “Price Is Basically Pinning Around Daily Pivot Level($71 ,
704)With Light Resistance Above At($72 ,
167)And Initial Support Near($71 ,
297)—A Balanced Intraday Posture Following Initial Push Higher.”
:Daily Bias Remains Bullish But Market Pauses Right At Logical Decision Zone.A Clean Break Above ($72,
000–$72,
500)Would Confirm Follow Through However Repeated Rejections Here Would Invite Fade Back Toward Mid-$60,
000s Over Time.
<H2 = “One Hour Chart(H1):
Momentum Bulls In Control Stretching Move”
“H4”
=“Intraday Emas”
<
H4 =
"Current Price"
="Price"
="$
=
"$76,"
=
"Current"
=
"Price:"
$
="$76,"=
"Current"
=$73,"
=$73,"
=$75."
=$75."
$"=
"
$
"$74."=
"=";
"=";
"=";
"
";
";";
";";
";";