The price of Bitcoin is currently facing the possibility of a prolonged correction below $80,000, as a staggering 6% year-over-year Producer Price Index (PPI) raises inflation concerns. Recent data from Google Trends, analyzed by Alphractal, reveals a significant disconnect between Bitcoin’s price movements and public search interest throughout this market cycle. The emergence of the classic ‘double-top’ reversal pattern indicates that there may be substantial risk for a breakdown beneath the critical support level at $79,000.
As it stands on Wednesday during U.S. market hours, Bitcoin has seen a decline of 0.91%, trading at approximately $79,750. This downturn follows macroeconomic pressures stemming from consumer and wholesale inflation data that have dampened hopes for Federal Reserve interest rate cuts. Despite sluggish price action and escalating geopolitical tensions exerting additional pressure on Bitcoin’s value, recent on-chain metrics suggest strong underlying resilience and an uptick in demand for $BTC. The question remains: can bulls defend the crucial floor at $75,000?
$BTC Faces Downside Risk as Analysts Flag Major Technical Red Alerts
Over the past three days, Bitcoin’s price has dropped from $82,361 to $79,270—a decrease of 3.75%—as various negative catalysts weighed heavily on risk assets.
This sell-off was largely driven by geopolitical news coupled with unexpectedly high U.S. inflation figures. Comments made by President Donald Trump regarding potential issues with Iran’s ceasefire added to market anxiety.
The Consumer Price Index (CPI) released on Tuesday indicated an annual inflation rate of 3.8%, slightly above Wall Street expectations—highlighting persistent consumer pricing pressures.
The optimism surrounding CPI quickly dissipated following the PPI report released on May 13th which delivered surprising results; wholesale prices surged by 1.4% month-on-month—the highest increase since March 2022—resulting in an annual rise to 6%. This robust PPI figure signals growing cost-push inflationary pressures likely to affect consumers soon.
This dual release fundamentally altered market sentiment; both consumer and producer prices are accelerating which has pushed back expectations for imminent Federal Reserve rate cuts further into the future.
A prolonged period characterized by ‘higher-for-longer’ interest rates tends to elevate risk-free yields while increasing opportunity costs associated with holding volatile assets like cryptocurrencies.
Despite these macroeconomic challenges faced today in markets worldwide,
recently gathered on-chain data reflects unwavering conviction among high-net-worth investors alongside historical patterns indicating potential recovery ahead.
$BTC Reserve Risk Drops Into Accumulation Territory
The Reserve Risk metric for Bitcoin has dipped into significantly lower ranges reminiscent of levels observed during Q4 2018 and Q3 2022.
This indicator measures long-term holders’ confidence relative to current prices; lower values indicate minimal selling pressure even near key resistance levels around $80k suggesting continued holding behavior among seasoned investors.
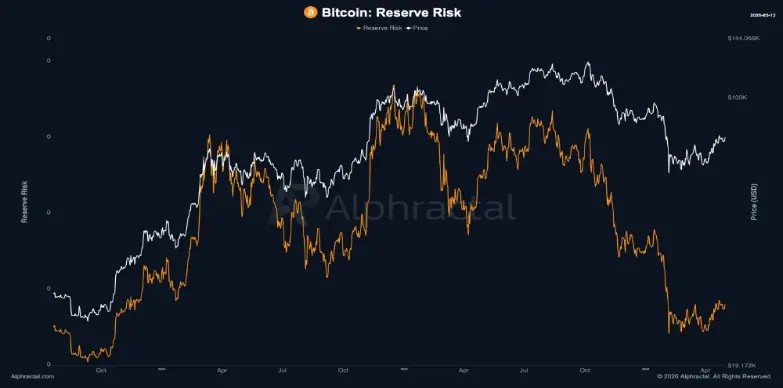
This metric is trending downward following previous highs similar
to patterns noted before extended accumulation phases occurred historically within crypto markets.
The distribution data appears increasingly consolidated as well over timeframes examined thus far!
Whales Accumulate Broadly as Retail Clusters in Single Zone
An analysis comparing Whale vs Retail Delta Heatmap shows clear divergence trends not witnessed since late-2024;
widespread buying interests exhibited across various pricing points among large-scale holders contrasts sharply against retail participants concentrated within narrower bands only!
This visualization highlights emerging asymmetries between whale activity versus retail participation:
a similar heatmap imbalance previously emerged roughly eleven weeks prior leading up towards significant price hikes recorded historically!
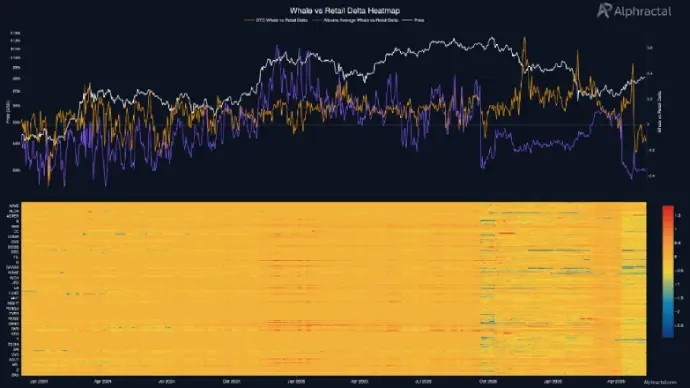
The ongoing current actions reflect broader fluctuations across financial markets,
with delta analytics underscoring contrasting behaviors between these two distinct groups involved actively trading now!
Bitcoin Search Interest Lags Behind Price in Unusual Divergence
Alphractal’s examination utilizing Google Trends suggests an atypical cycle prevailing within cryptocurrency realms surrounding bitcoin itself:
In prior bull runs notably seen during peaks reached back around early-2021 periods where spikes occurred closely aligned alongside rising valuations observed regularly then too!
Currently however we see something different occurring altogether – although btc surged upwards nearing approximately ~$137k initially before retracting downwards nearly ~40%, overall search volumes related specifically remained relatively flat throughout both rallies & subsequent declines experienced recently also…this gap widens considerably compared against previous cycles tracked earlier !
Another observation derived involves who exactly drove recent movements behind such changes occurring here lately…unlike what transpired through mid-20s years when retail activities clearly dominated searches made visible , appreciation phases observed heading forward appear tied more closely towards ETF approvals along institutional inflows rather than typical consumer-driven purchasing habits normally seen traditionally .
This division signifies perhaps still large waves incoming demand yet waiting patiently outside ready poised enter into marketplace soon enough ;historically spikes correlate directly coincide tightly together just prior most intense surges witnessed !

& nbsp ; & nbsp ; & nbsp ; & nbsp ;
& # xA0 ; & # xA0 ; & # xA0 ;
BTC trades well below its recent highs yet public buzz remains fairly low overall indicating elements setting up previous “blow-off” tops missing entirely including mass participation media-driven curiosity hype social frenzy etc.& lt;/ span >
$ BTC
Price Correction May Extend To $72K If Chart Pattern Plays Out
With today’s drop extending second reversal attempts originating near resistance zones previously identified ($82k), pullbacks now occur positioned right along trendlines signaling overhead supply pressuring coin values persistently moving downward consistently over time frames monitored thus far!& lt;
/
b >
. After all February ‘26 saw active resonance occurring amidst two parallel lines offering supportive resistances traders alike rely upon heavily going forward hereafter …historically retests upper boundaries often renew selling pressure causing notable corrections thereafter too !
A deeper analysis conducted using four-hour charts reveals formation classic double-top pattern reinforcing risks associated prolonged corrections taking place ahead possibly downwards breaking neckline supports identified previously showing charted details below displayed images provided herein!
If breakdown holds true ,btc could extend deeper corrections reaching ~5 .88 % retesting closer areas marked under~$75 k followed eventually targeting regions around ~$72 k subsequently revisiting mentioned channel supports once again thereafter if confirmed valid scenarios unfold accordingly moving forwards beyond next few days/weeks ahead !
Conversely should btc manage sustain above floors set forth earlier (~$79 k), trajectory might switch sideways instead allowing brief consolidations drive eventual breakout attempts forthcoming thereafter very shortly indeed!
FAQ:
Q: What does it mean if Bitcoin faces downside risks?
A: It indicates that analysts believe there may be further declines or corrections in its value due to various economic factors.
Q: How do technical indicators like double-tops impact trading decisions?
A: Double-tops signal potential reversals or bearish trends which traders use to adjust their positions accordingly.
Q: Why is search interest important for cryptocurrencies?
A: Search interest can indicate public sentiment toward cryptocurrencies which often correlates with buying behavior.
Q: What role do whales play in cryptocurrency markets?
A: Whales are large holders whose buying/selling actions can significantly influence asset prices due their volume traded compared smaller retail participants.
Q : Can we expect another surge after this correction phase ?
A : While it’s uncertain , historical patterns suggest recoveries typically follow corrective periods given sustained investor confidence returns post-adjustments.