Bitcoin is entering a critical phase in its recovery journey. After several weeks of rebuilding following the February downturn, the market has shifted from merely defending support levels to actively targeting a significant resistance zone around $80K. This area represents a pivotal point where a minor relief rally could either evolve into something more substantial or face rejection and revert back into previous trading ranges.
Bitcoin Price Overview: Daily Chart Insights
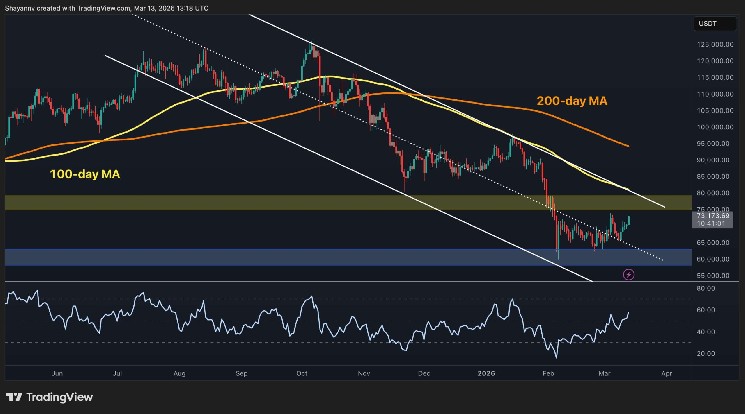
The daily chart shows signs of improvement, although it hasn’t fully transitioned to a bullish stance yet. Bitcoin has risen from the blue demand zone near $60K to approximately $62K and is now approaching the former breakdown region between $75K and $80K. This development is noteworthy since this yellow zone previously served as support before being lost during the broader downtrend. Reaching this level again indicates that buyers are regaining some control; however, reclaiming it remains an entirely different challenge.
The overall structure still necessitates caution. The price continues to linger below both the declining 100-day and 200-day moving averages, which are still trending downward—indicating that the macro trend has not yet been repaired. In simpler terms, Bitcoin is attempting to rally amidst overhead supply while remaining beneath significant trend filters. If buyers can achieve daily acceptance above the $75K mark, it would significantly enhance the technical outlook; otherwise, this situation may simply represent a rebound within an ongoing corrective phase.
$BTC/USDT Four-Hour Chart Analysis
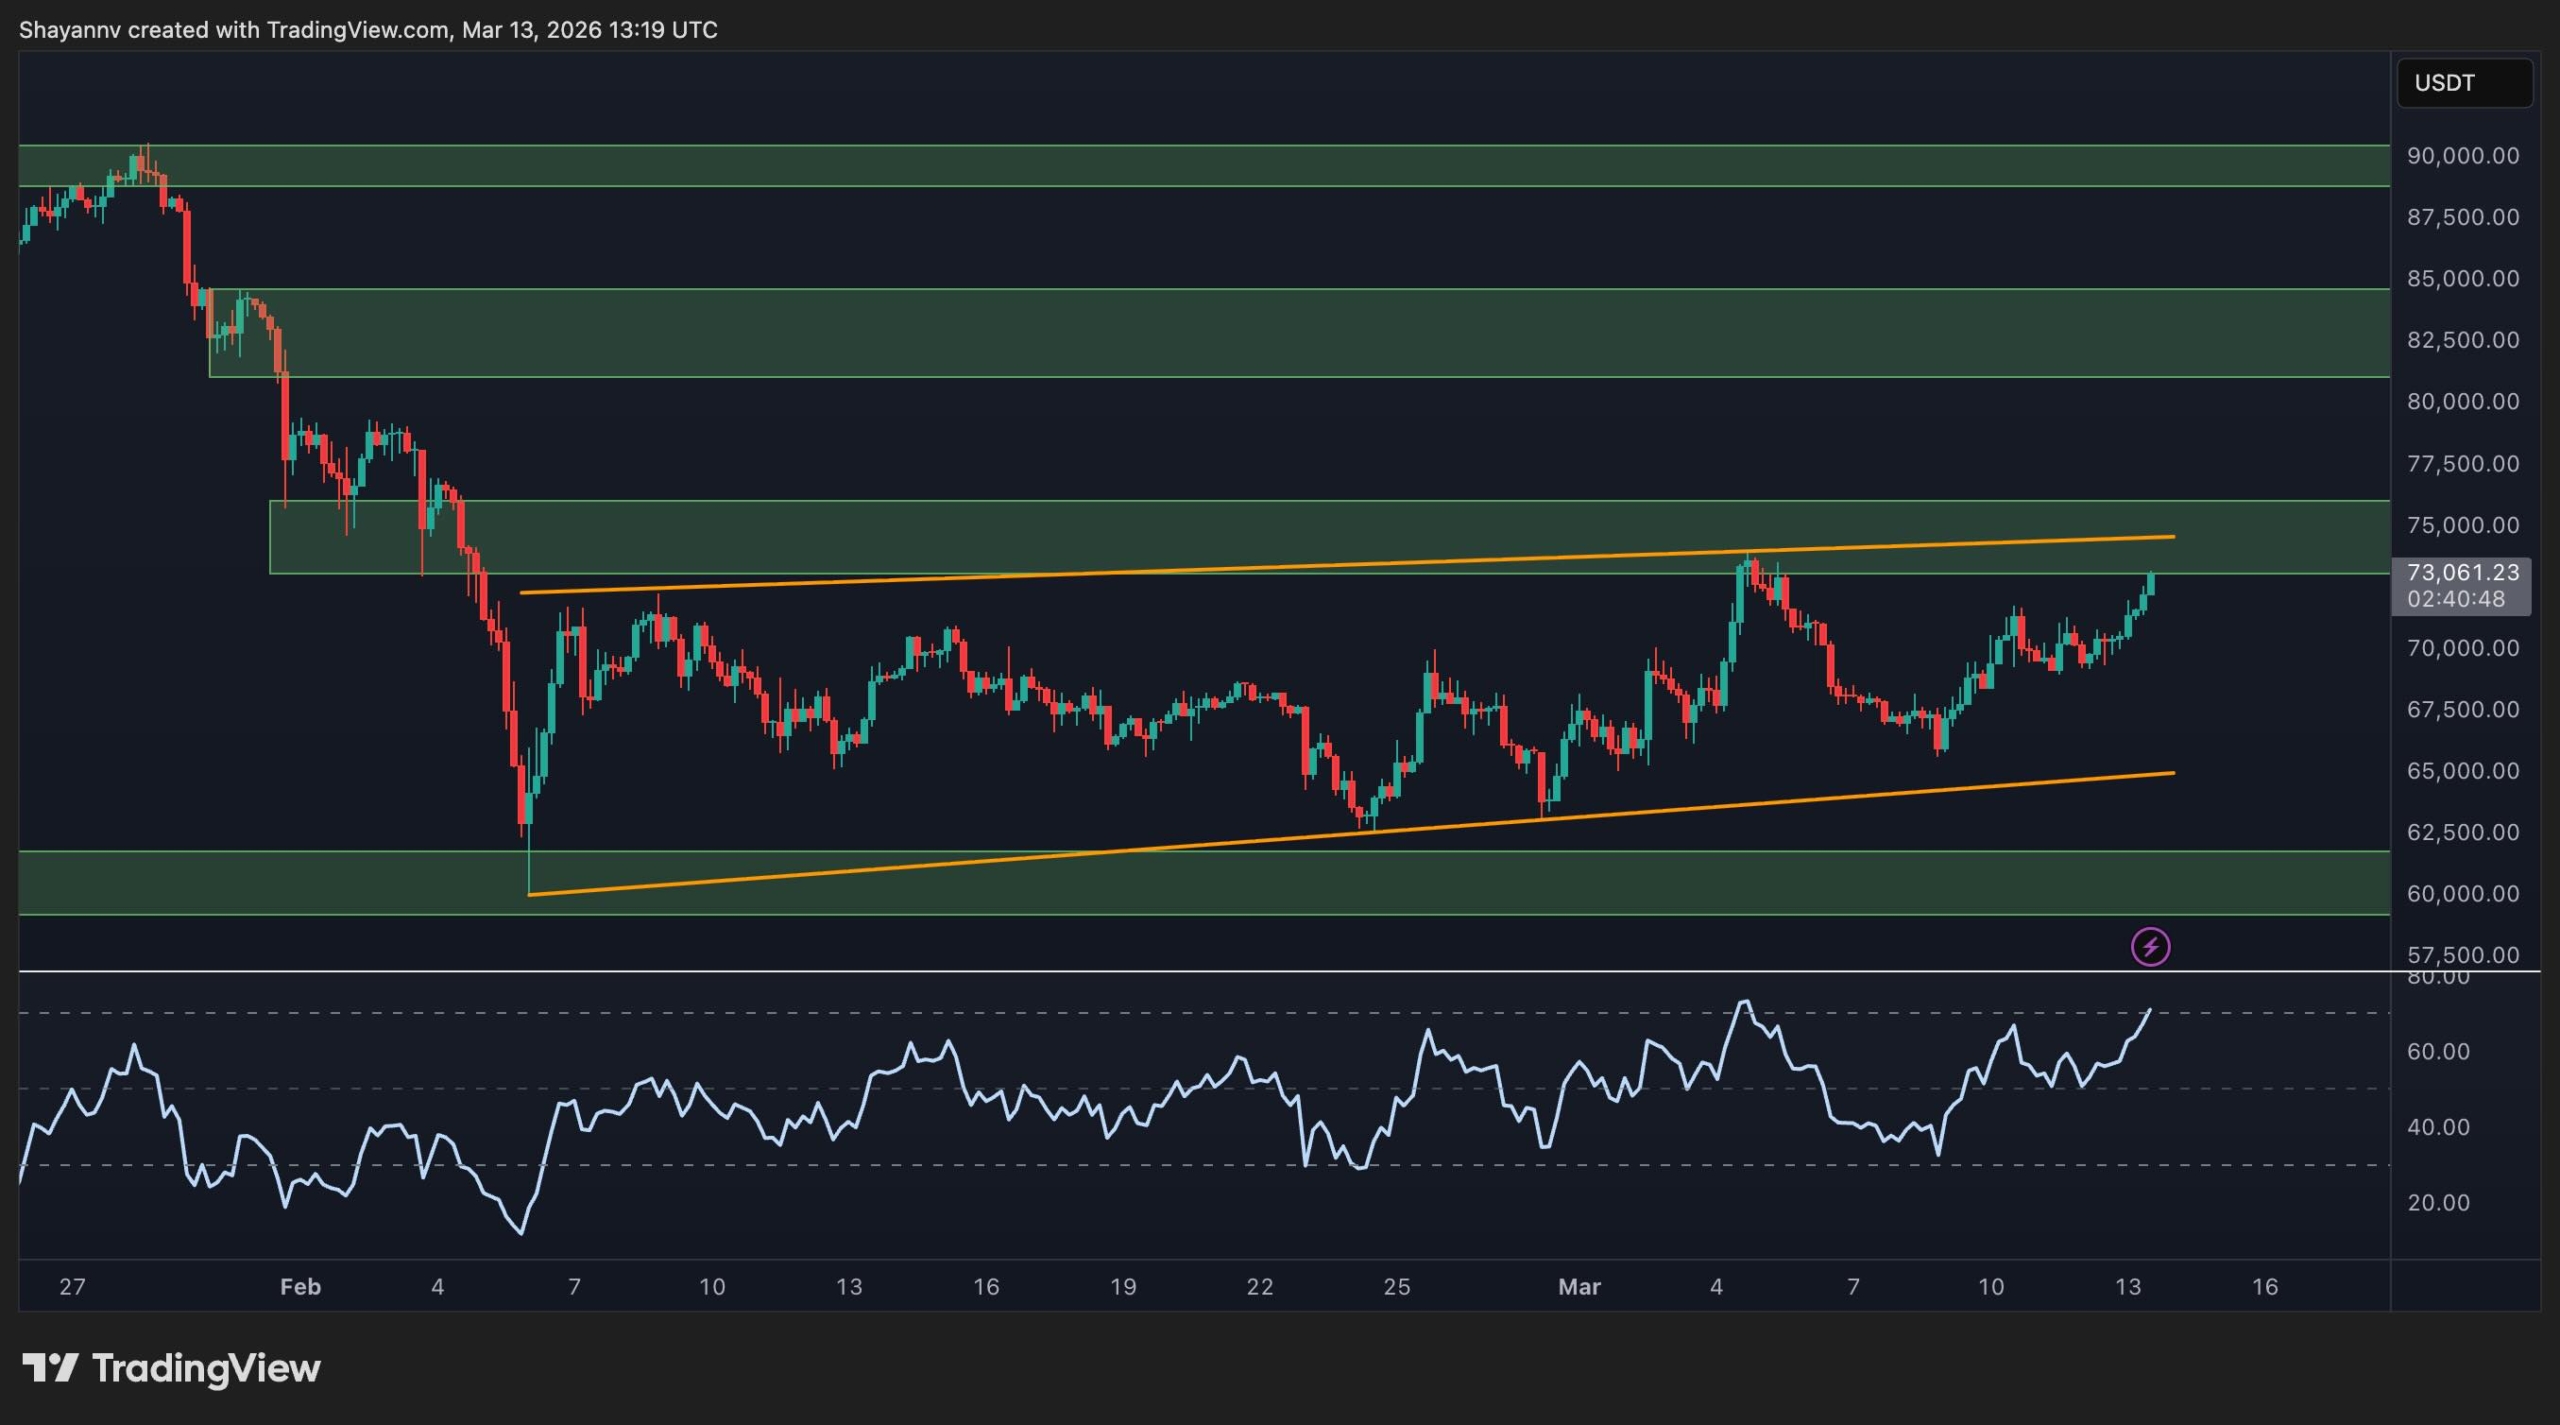
On examining the four-hour chart, we see that Bitcoin’s recovery appears much more structured and organized. The cryptocurrency has been forming an ascending pattern characterized by higher lows; recently, it has moved closer to reaching its upper boundary once again. The market isn’t just drifting upward anymore—it’s actively challenging resistance levels—a behavior typically preceding either breakout or sharp pullback scenarios.
The momentum indicators bolster expectations for short-term strength as RSI approaches its upper range limits; however, this also implies that Bitcoin arrives at resistance with momentum already stretched thinly across these levels. Therefore, what happens next becomes crucial: A decisive break above both channel top and supply band ranging from $73K to $75K would suggest further continuation towards subsequent overhead zones; conversely, any rejection here could likely push prices back toward mid-range values—prolonging market consolidation.
On-Chain Metrics Analysis
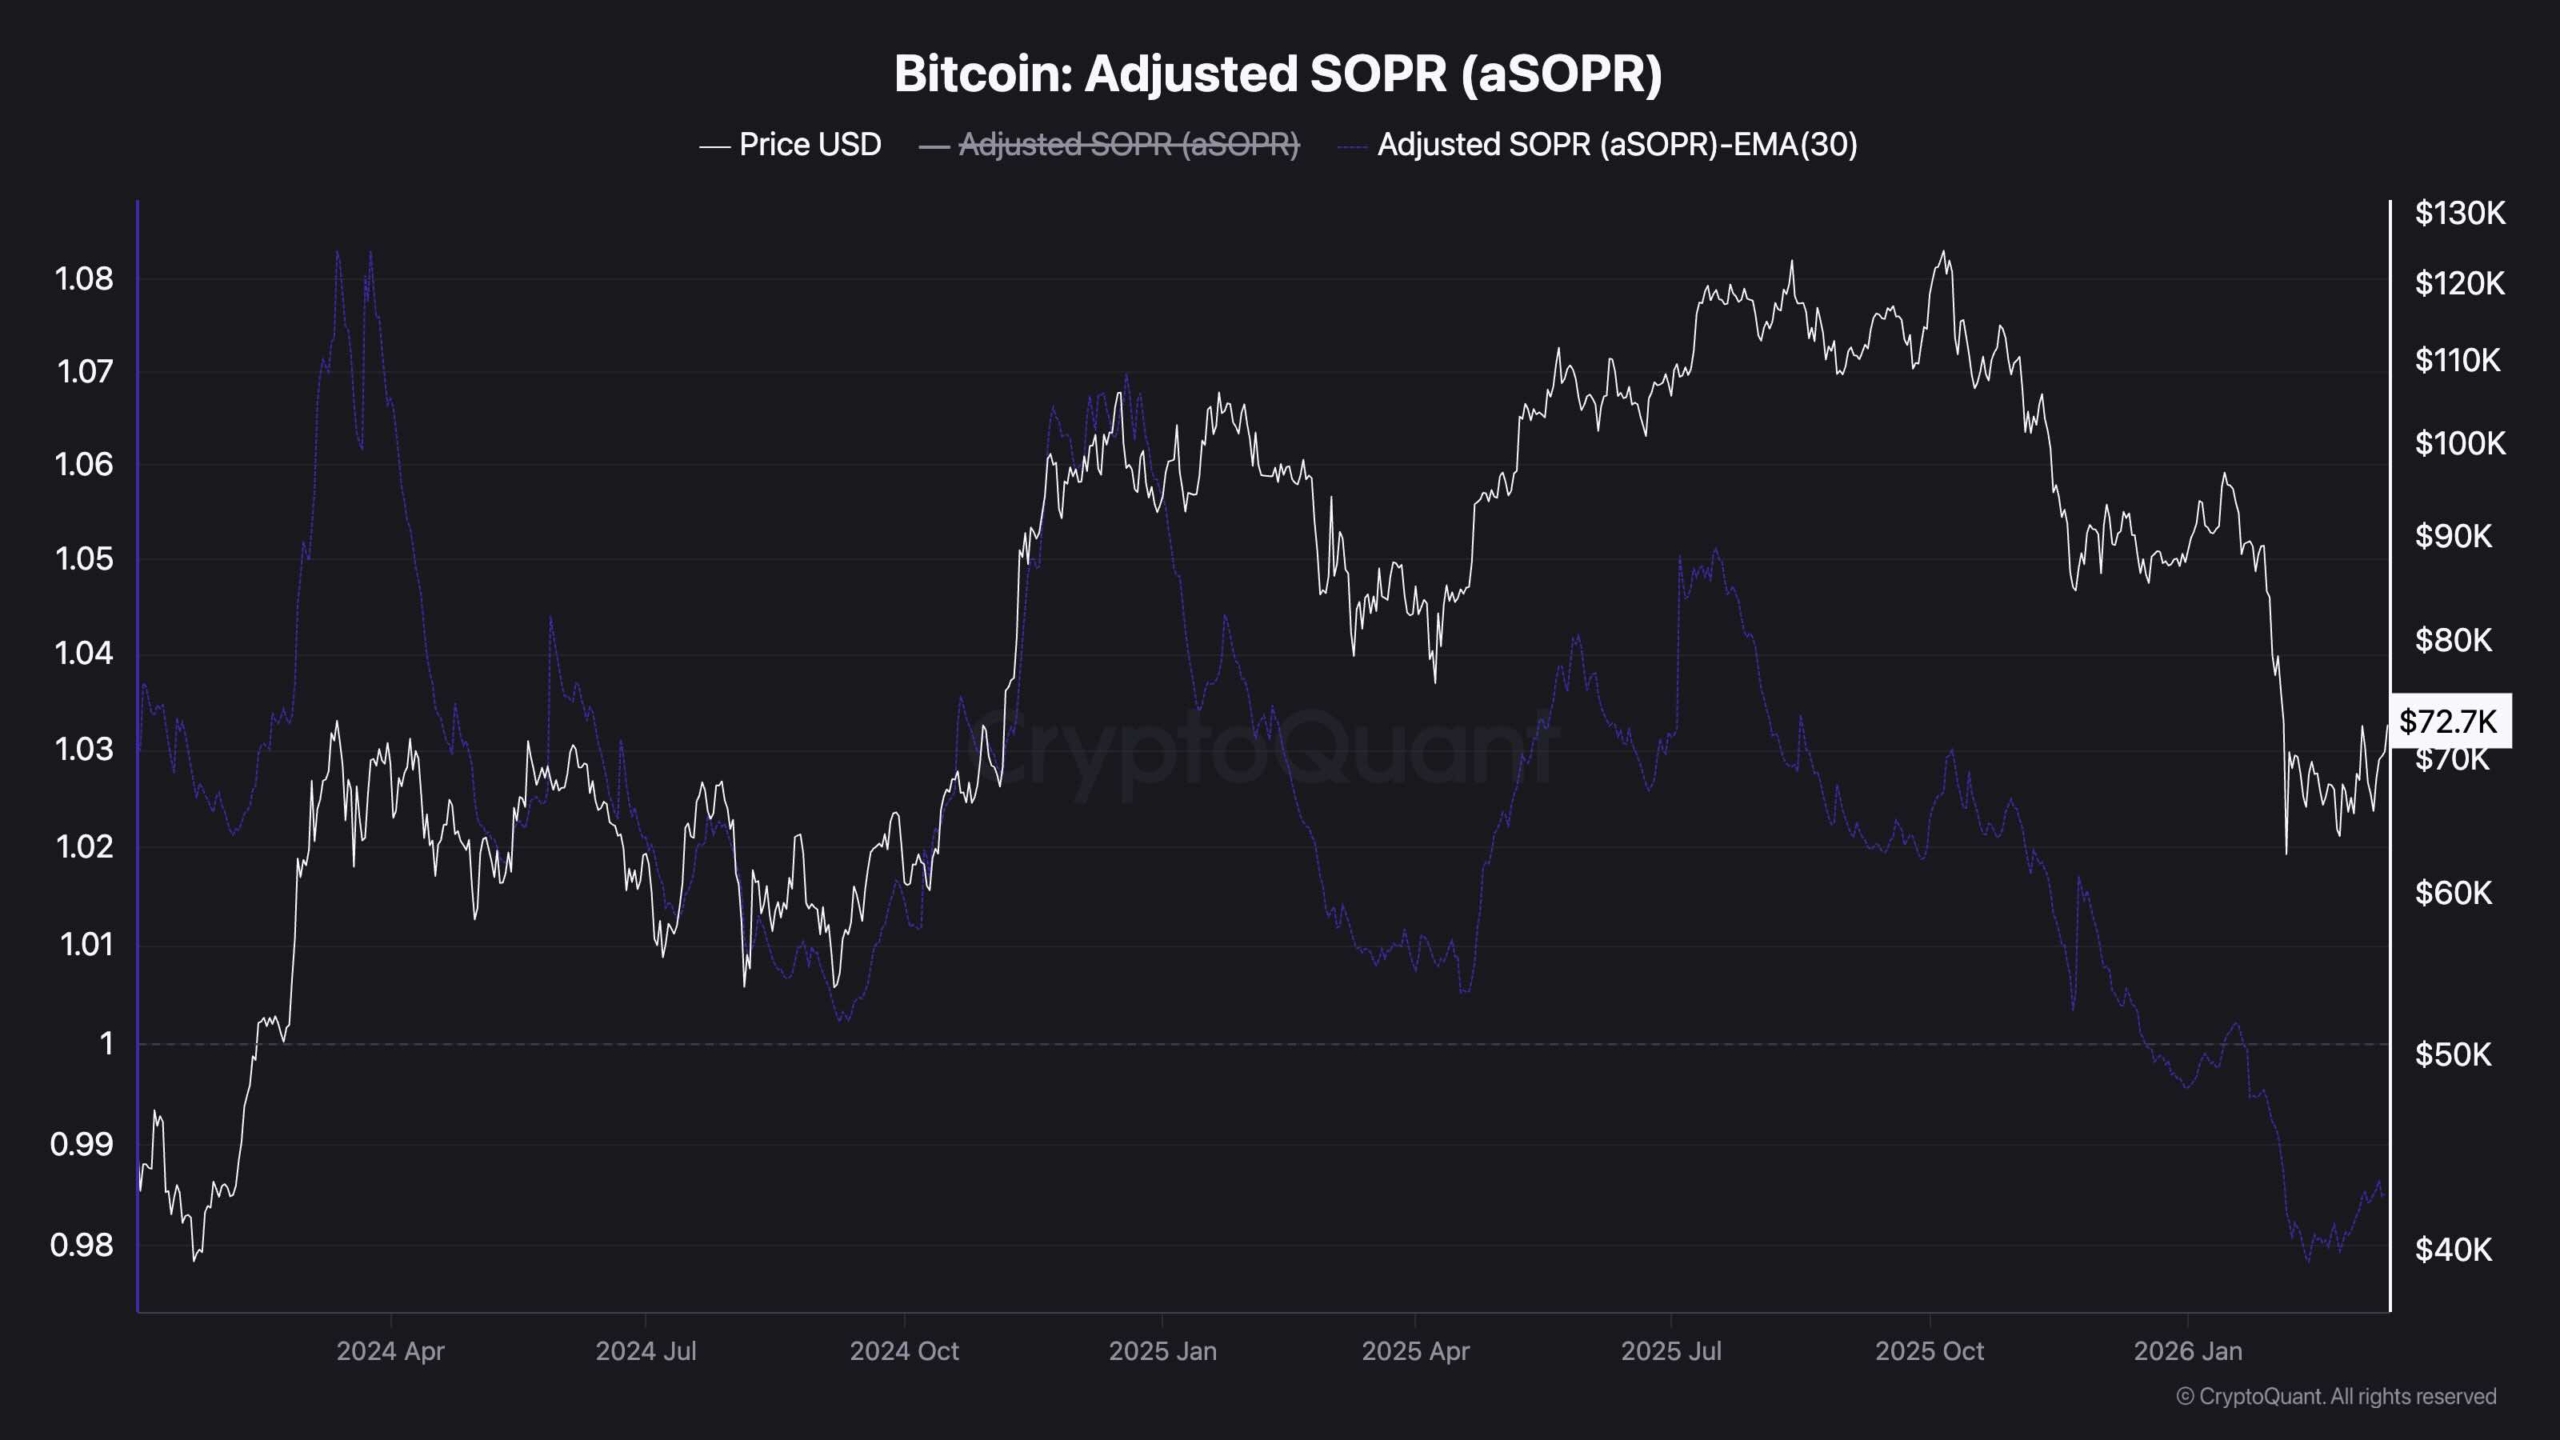
The on-chain landscape introduces intriguing dynamics into our analysis of Bitcoin’s performance metrics—the adjusted SOPR remains below 1—which indicates that coins transacting on-chain are generally being sold at losses on average during this period of correction or transition when profit-taking behaviors have not fully resumed among participants in markets yet despite recent price recoveries suggesting otherwise.
Simultaneously though,aSOPR shows signs of rebounding from recent lows—this presents early indications pointing towards improving conditions ahead—not sufficient alone for confirming new expansion phases but hinting strongly at potential alleviation regarding capitulation pressures felt by markets previously experienced recently behind us now too! In other words: As prices test resistances while on-chain behaviors seek healing pathways forward if alignment occurs through confirmed breakouts alongside movements returning above 1 within measures like those observed via aSOPR then we could see enhanced bullish prospects for Bitcoin emerge considerably stronger than before!