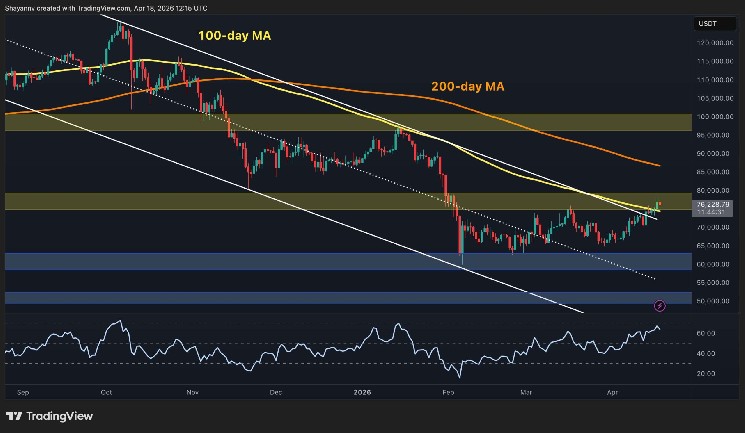
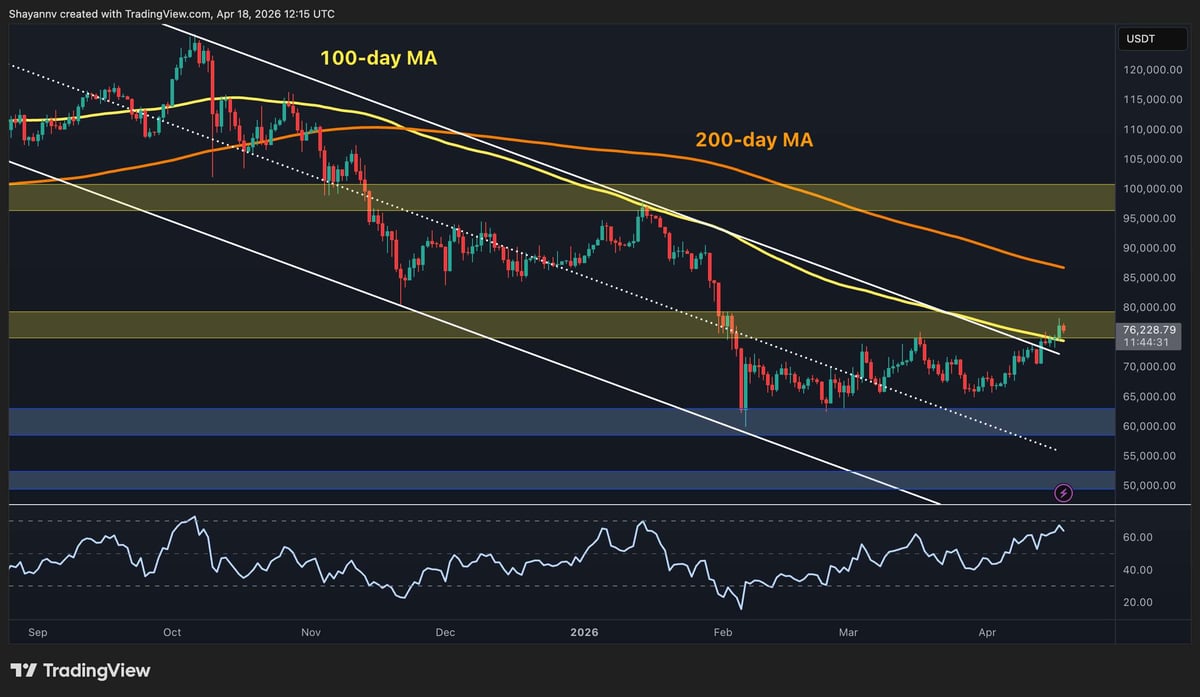
Currently, Bitcoin is trading at approximately $76,200, marking its highest value since the downturn in February. It has officially entered the resistance range of $75,000 to $80,000 that has characterized recent price consolidation. This upward movement signifies a significant advancement in its recovery trajectory. Notably, $BTC has successfully surpassed both the descending channel and the 100-day moving average simultaneously—an encouraging sign if this trend continues over the next few weeks.
Bitcoin Price Evaluation: Daily Chart Insights
$BTC has clearly broken through both the upper limit of its descending channel and crossed above the 100-day moving average (approximately $75k) on daily charts. The Relative Strength Index (RSI) now exceeds 60—a peak not seen since January when $BTC was valued around $95k. This represents one of the most favorable daily setups observed in recent months; for once, technical indicators are leaning towards buyers rather than merely indicating seller fatigue.
The immediate concern is whether $BTC can maintain a close above this resistance zone of $75k–$80k and convert it into a support level. Establishing this zone as a solid foundation could be crucial for upcoming months; consistently reclaiming it would signify an important structural change. Should it succeed beyond this point, obstacles such as the 200-day moving average (around $86k–$87k) and critical supply levels between $95k and $100k will come into play. Conversely, previous upper boundaries may provide support during any retests with deeper floors identified around the vicinity of $60K.
$BTC/USDT Four-Hour Chart Analysis
The four-hour chart indicates that earlier in the week,$BTC briefly breached through its ascending channel’s upper boundary reaching up to about$78K before retracting back within that channel again.The current price rests just beneath that boundary which often suggests short-term consolidation or correction following an unsuccessful breakout attempt.
The RSI on this timeframe also shows signs of retreat from overbought conditions but does not yet indicate a reversal trend is imminent.A sustained consolidation above$74K-$75K followed by another push upwards would represent an ideal scenario for buyers.On another note,a drop below recent structural lows near$74K could raise concerns prompting reevaluation regarding short-term market outlooks pointing toward potential bearish shifts within four-hour timeframes.

On-Chain Insights Analysis
The Bitcoin Coinbase Premium Index has shifted positively into positive territory with readings hovering around +0 .03.This marks notable improvement since corrections intensified late last year.After enduring several months characterized by negative prints especially during February crash period where index plunged towards -0 .20 ,this transition reflects significant behavioral changes among US-based buyers utilizing Coinbase platform.
This timing aligns perfectly alongside$ BTC ’s breakthrough beyond descending channels suggesting genuine demand originating from US markets instead being solely influenced offshore or derivatives activities.During last year’s bull run,Coinbase Premium maintained consistent positivity throughout entire rally period .
A single week’s worth positive readings doesn’t recreate past dynamics however directional shift remains noteworthy.If premium continues strengthening while holding above zero amid rising prices approaching resistance bands ($75 K-$80 K),it adds substantial conviction supporting notion recovery backed institutions rather than purely driven technically alone.