Bitcoin is currently navigating a precarious situation. It is probing the lower limits of its recent consolidation phase following a notable decline from the peaks observed in late 2025. The market structure indicates that a potential accumulation zone may be emerging, with short-term fluctuations occurring within an expanding channel.
Despite this, volatility remains high, and the upcoming trading sessions will be critical in determining whether $BTC can establish a support level above $60k or if it will drop further towards the $50k support area or even lower.
Bitcoin Price Overview: Daily Chart Analysis
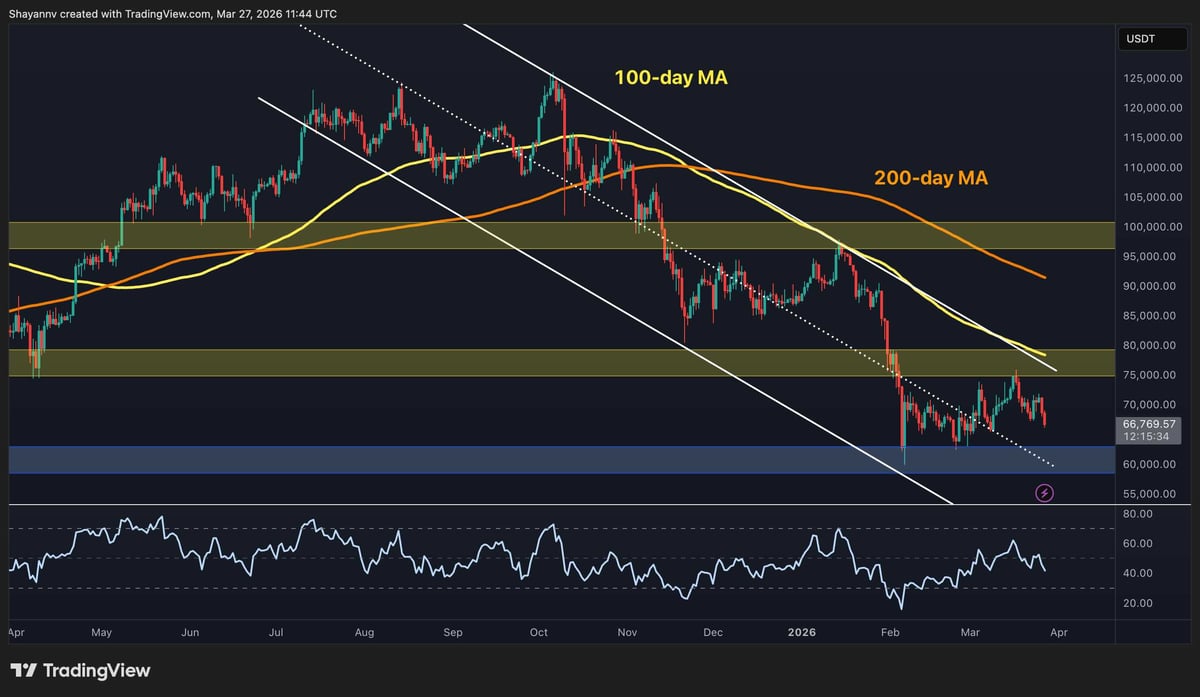
Examining the daily chart reveals mixed signals for $BTC. The price continues to hover below both the 100-day (yellow line at approximately $80k) and 200-day (orange line at around $90k) moving averages while remaining trapped within a broad descending channel. This scenario reinforces a bearish medium-term outlook. Nevertheless, current consolidation occurs just above robust support near $60k, aligning with previous liquidity and demand zones.
The RSI has rebounded from deeply oversold conditions near the range’s bottom but has started to decline again after facing resistance around the $75k mark. Consequently, as prices continue to drop, another test of this crucial demand zone at $60k seems imminent in the coming days; thus, $BTC‘s trajectory over both short and medium terms heavily relies on how markets respond at this pivotal level.
$BTC/USDT Four-Hour Chart Examination
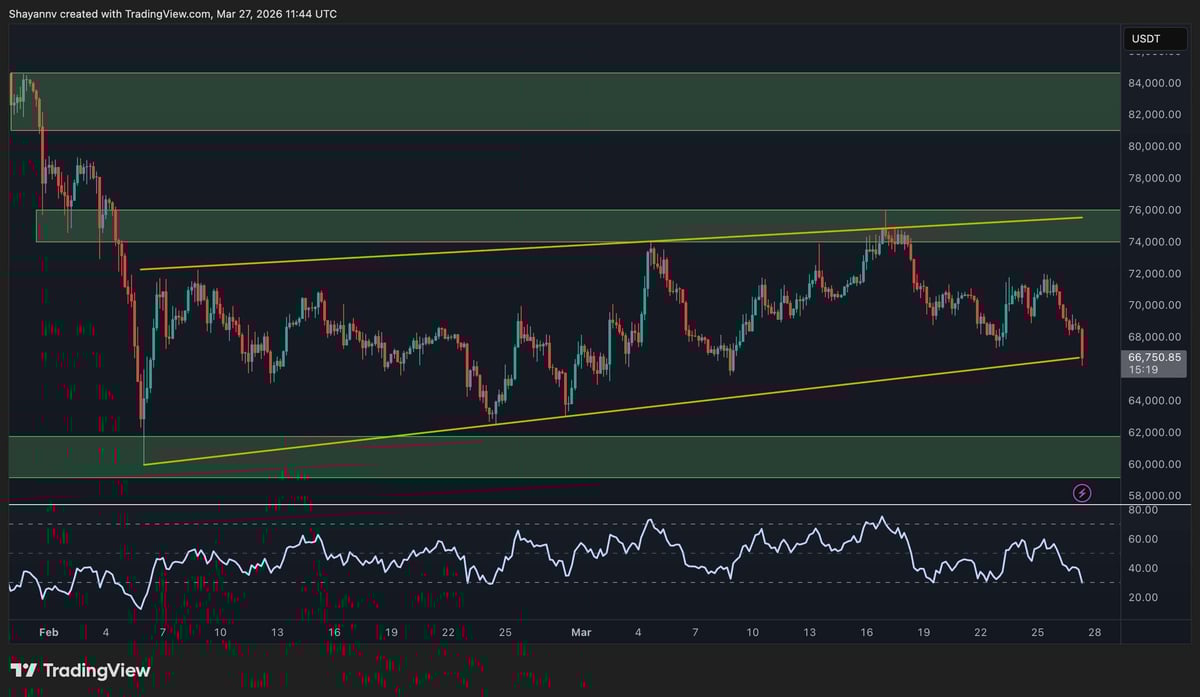
Diving into the four-hour chart reveals that $BTC has been forming an ascending channel resembling an extensive bearish flag pattern. Over recent months, it has consolidated within a broad range between $60k and $75k—bounded by significant support and resistance levels as well as channel boundaries.
The recent rejection from around $75k is more pronounced on this timeframe; following an unsuccessful breakout attempt above both horizontal resistance areas and channel boundaries led to marked declines toward lower boundary levels that are now close to breaking down.
The RSI also sits low near oversold territory; hence buyers face bleak prospects in this short-term outlook since any breakdown of channels could trigger another downturn towards approximately $60k once again instilling market anxiety.
On-Chain Insights Analysis
An analysis of on-chain metrics sheds light on vital elements of today’s cycle. The LTH-SOPR/STH-SOPR ratio has dropped below one—reaching levels reminiscent of those seen during last market cycle’s accumulation phase back in 2023.
This ratio compares profit realization between long-term holders (LTH) against short-term holders (STH). A reading under one signifies that LTHs are either selling their holdings at losses or merely breaking even while STHs face considerable pressure.
<pHistorically speaking such low readings have aligned with market bottoms alongside strong accumulation phases indicating current metric declines may represent capitulation among weaker hands while more patient investors accumulate $ BTC within ongoing ranges potentially setting groundwork for future bullish movements .
However , these signals should ideally coincide with positive price actions soon since even steadfast investors cannot endure massive drawdowns indefinitely .
