Bitcoin ($BTC) is currently experiencing a prolonged phase of consolidation following significant price drops earlier this year. The cryptocurrency remains trapped within a horizontal range, indicating uncertainty among traders in the short term. Attempts to push back towards resistance levels around $75,000 have faced selling pressure, while support near $60,000 has proven resilient, establishing the lower limit of this trading range.
Bitcoin Price Overview: Daily Chart Insights
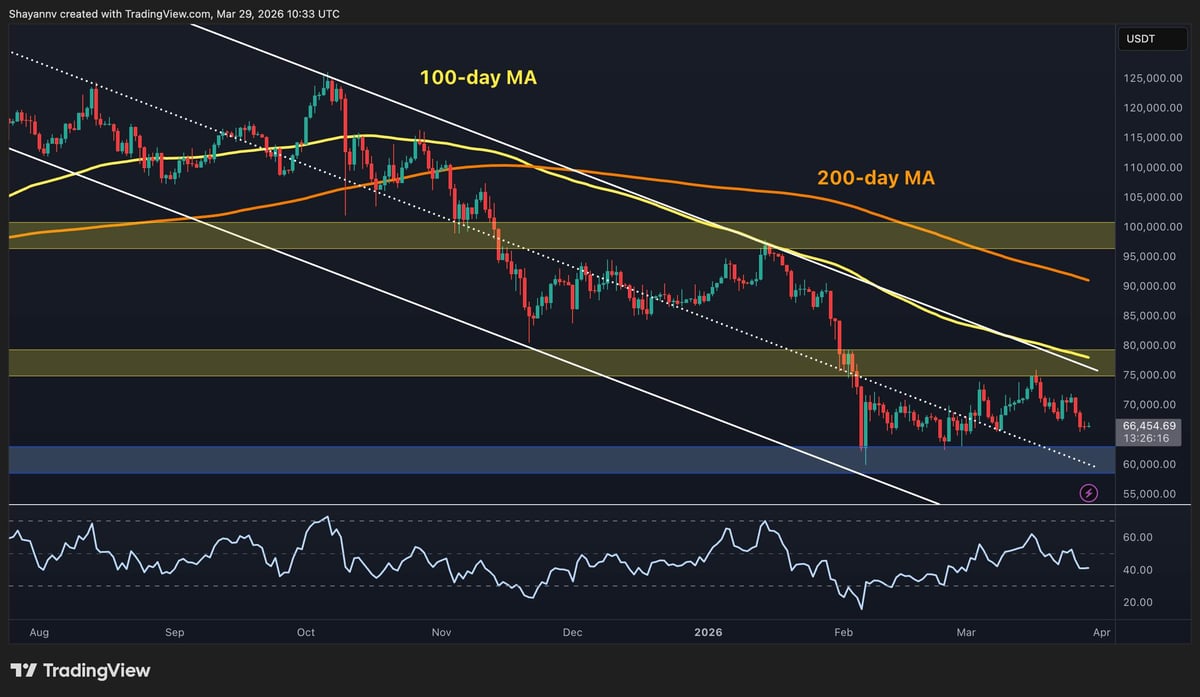
Examining the daily chart reveals that $BTC has formed distinct lower highs and lows since reaching its peak above $125,000. The overall trend appears bearish as both the 100-day (~$78k) and 200-day moving averages (~$90k) are trending downward above current prices, creating additional resistance overhead.
The recent attempt to rally towards the $75k supply zone was unsuccessful; furthermore, $BTC failed to reach either the upper boundary of a significant descending channel or approach the nearby 100-day moving average. This suggests that sellers remain active at elevated price levels and continue to sell during brief rallies. Although there has been some recovery in RSI over recent months, it still sits below 50—indicating limited bullish momentum.
$BTC/USDT Four-Hour Analysis
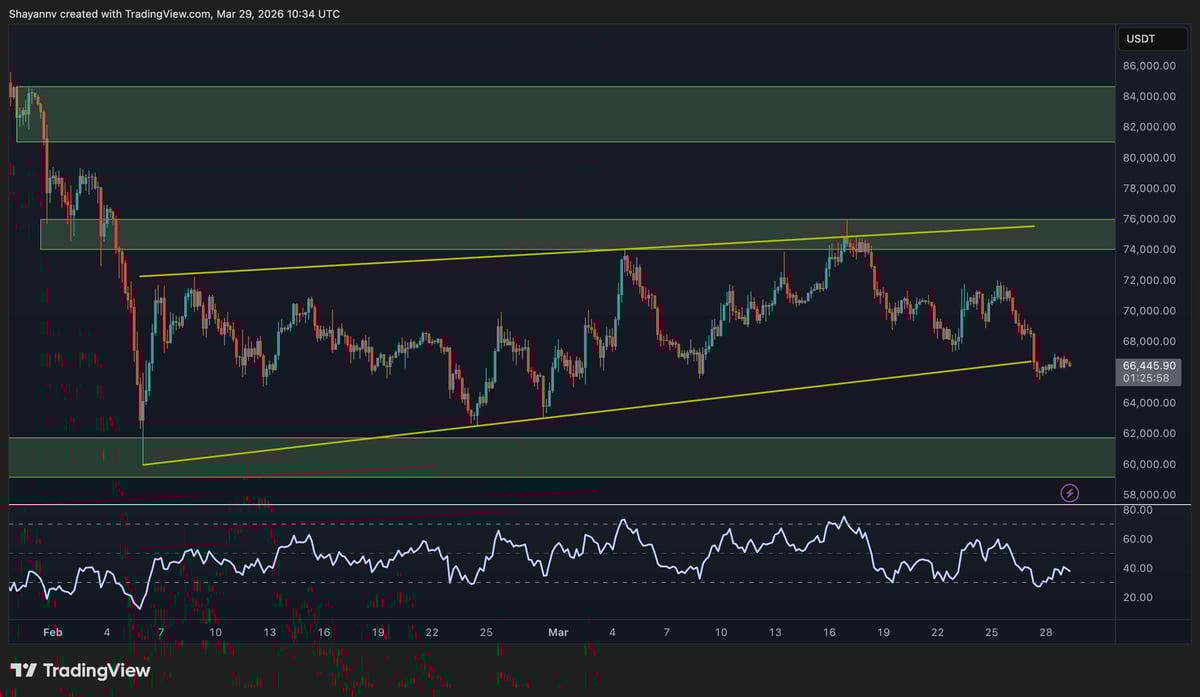
Diving into the four-hour chart shows that $BTC recently underwent a bearish shift after being rejected at crucial resistance around $75k and hitting the upper edge of its flag pattern. In this shorter timeframe analysis, we observe lower highs and lows as market dynamics break below key trendlines.
The short-term RSI indicates nearing oversold conditions due to recent sell-offs; thus minor relief rallies or periods of consolidation may be on the horizon. However, with ongoing descending trends and multiple bearish imbalances forming overhead, any upward movements could encounter substantial resistance ahead. Consequently, short-term traders might be preparing for another test of support near $60k in upcoming days.
On-Chain Metrics Analysis
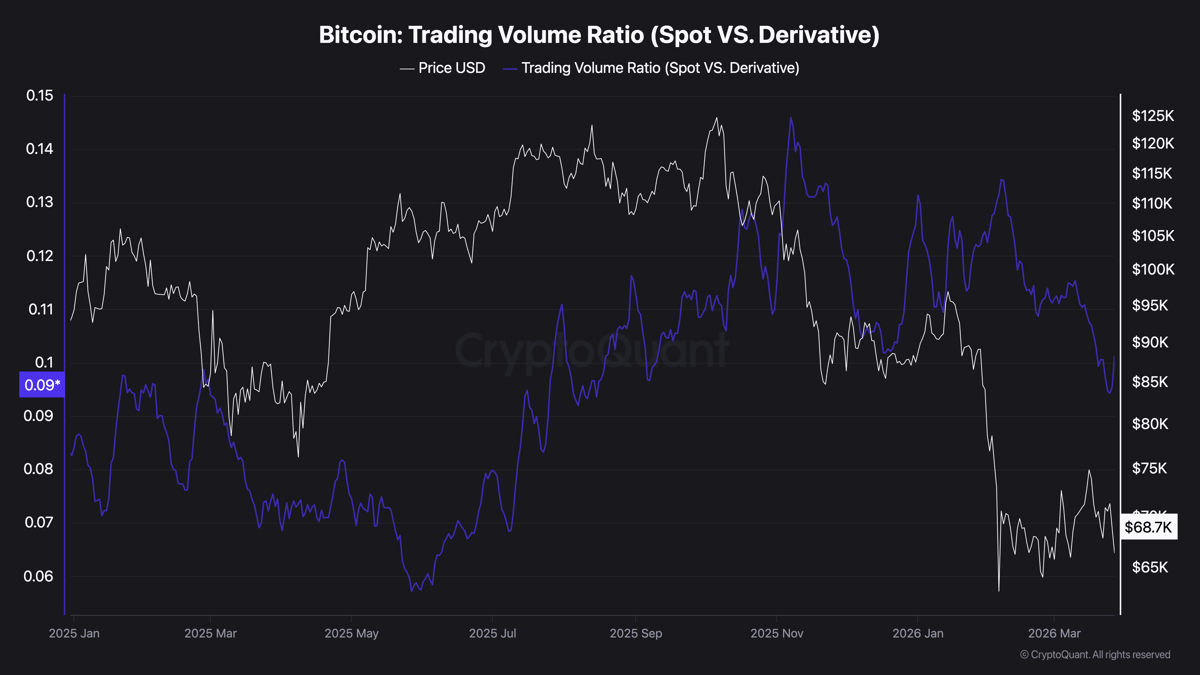
The ratio between spot trading volume and derivative trading volume for $BTC has seen a notable decline recently. This shift suggests an increasing preference for derivatives over actual spot transactions among traders—a tendency toward leveraging rather than direct buying or selling which often leads to heightened volatility in shorter timeframes.
This reliance on leveraged positions means even small fluctuations can trigger exaggerated market reactions; if critical support or resistance levels are breached sharply swings may occur either way as participants react swiftly. Such conditions reveal an unstable short-term market structure despite ongoing price consolidation but lean more toward potential liquidation cascades—most likely resulting from continued bearish movements leading to long liquidations being more probable than bullish outcomes.