Bitcoin Price Evaluation: The Present Market Landscape
The cryptocurrency market finds itself at a pivotal moment as we progress through March 2026. Following a series of local peaks, Bitcoin’s value has retracted to find stability within the $68,500 to $69,500 range. While some retail investors may interpret this sideways trend as a sign of weakness, seasoned traders view it as a high-probability “coiling” phase. This consolidation period frequently precedes significant directional movements, presenting an exceptional opportunity for those aiming to trade Bitcoin with strategic intent.
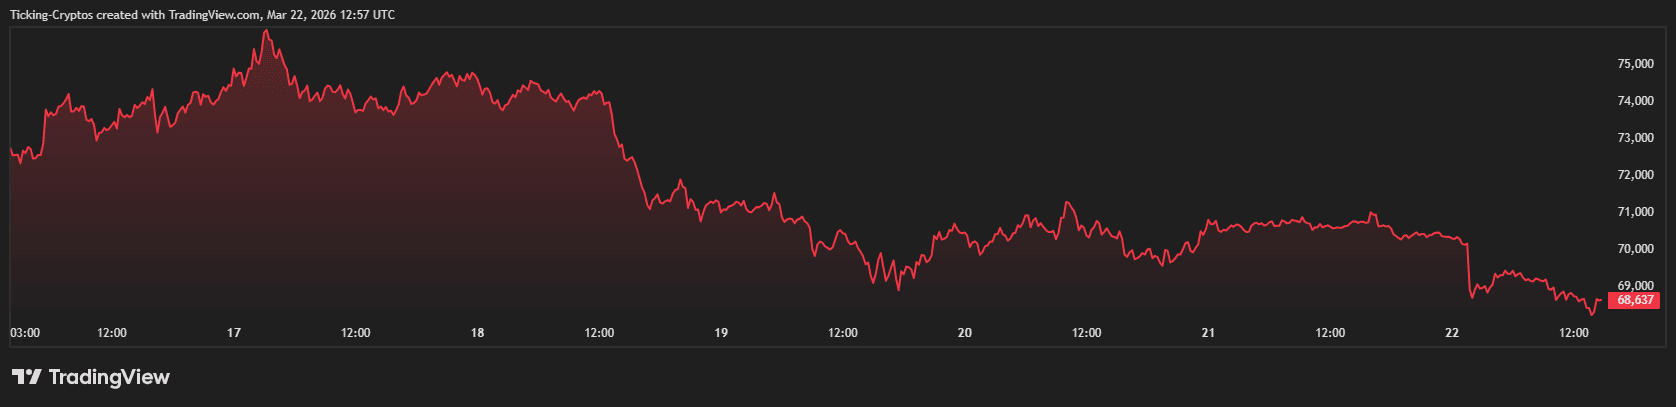
Bitcoin price in USD over the past week
Bitcoin Price Forecast: Is $75,000 on the Horizon?
The current analysis indicates that Bitcoin’s price trajectory for the remainder of Q1 2026 is closely tied to the psychological barrier at $70,000. As of March 22, 2026, $BTC is trading around $68,625 after experiencing a slight pullback from its recent surge. For traders navigating this “calm period,” there are clear technical boundaries visible on the $BTC-USD chart that facilitate well-defined risk management and favorable entry points ahead of potential volatility spikes.
Understanding Bitcoin Price Movements and Volatility
To take advantage of these market dynamics effectively requires comprehension of $BTC/USD price movements. Price action denotes how an asset’s price fluctuates over time; currently observed is a “Bull Flag” pattern on daily charts. Successfully trading this involves pinpointing support levels (where buying interest emerges) and resistance levels (where selling pressure initiates).
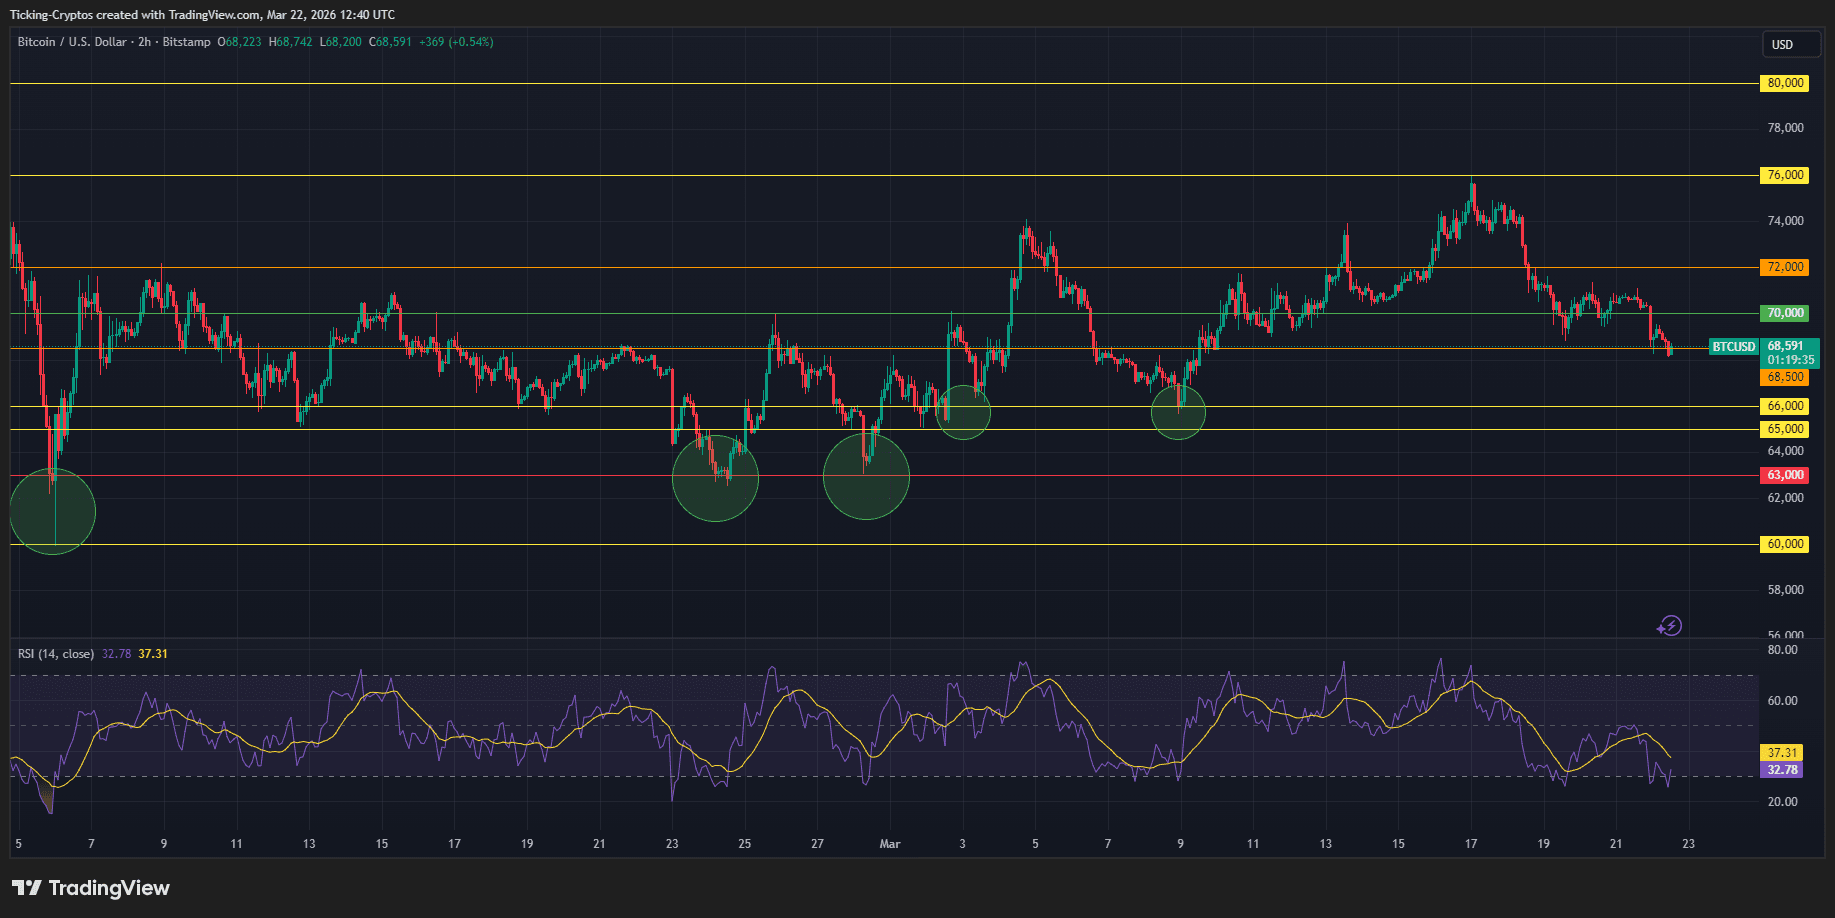
A Technical Analysis: Key Levels for Bitcoin Pricing
An examination of present market conditions reveals an emerging pattern following late 2025’s “flash crash,” during which months were spent establishing support.
The Technical Framework
- Support Zone: Ranging from $65,000 – $68,000; heavily defended by institutional investors or “whales.”
- Resistance Zone: Between $72,000 – $76,000; breaking through this ceiling could pave the way toward reaching values near $100k.
- Causal Relationships: Currently,$BTC shows growing correlation with S&P 500 trends according to Bloomberg data—often foreshadowing heightened volatility in Bitcoin pricing.
A Professional Approach to Trading Bitcoin Amidst Consolidation
Diving into trading strategies during consolidation phases can be more profitable when one reacts rather than predicts directionality. Here’s how professionals recommend approaching current trades in Bitcoin:
- The Range Strategy: Purchase near support at approximately $67,500 while placing tight stop-loss orders around$66 ,000 . Aim for upper resistance set at$72 ,000 .
- The Breakout Strategy: Implement a “Buy Stop” order positioned at$72 ,500 . A breakout above this level accompanied by substantial volume confirms bullish momentum .
- The Hedge Approach : Utilize hardware wallets for long-term holdings while reserving only active capital on reputable exchanges .
Main Factors Influencing Bitcoin Prices
Although technical indicators provide valuable insights , underlying fundamentals shape overall sentiment within markets . In lightof Federal Reserve policies throughout 2026 exerting pressureon riskier assets , increasing adoption ratesfor BTC as reserve currency create favorable regulatory environments long term driving demand upward creating outperformance against broader indices available across various sectors .