Bitcoin is currently trading at approximately $71,000 as global markets adopt a cautious stance. Investors are keenly observing the durability of the recently declared ceasefire between the US and Iran, as well as its potential impact on overall risk sentiment.
In light of ongoing geopolitical uncertainties, cryptocurrency markets seem to prefer consolidation over making any decisive moves.
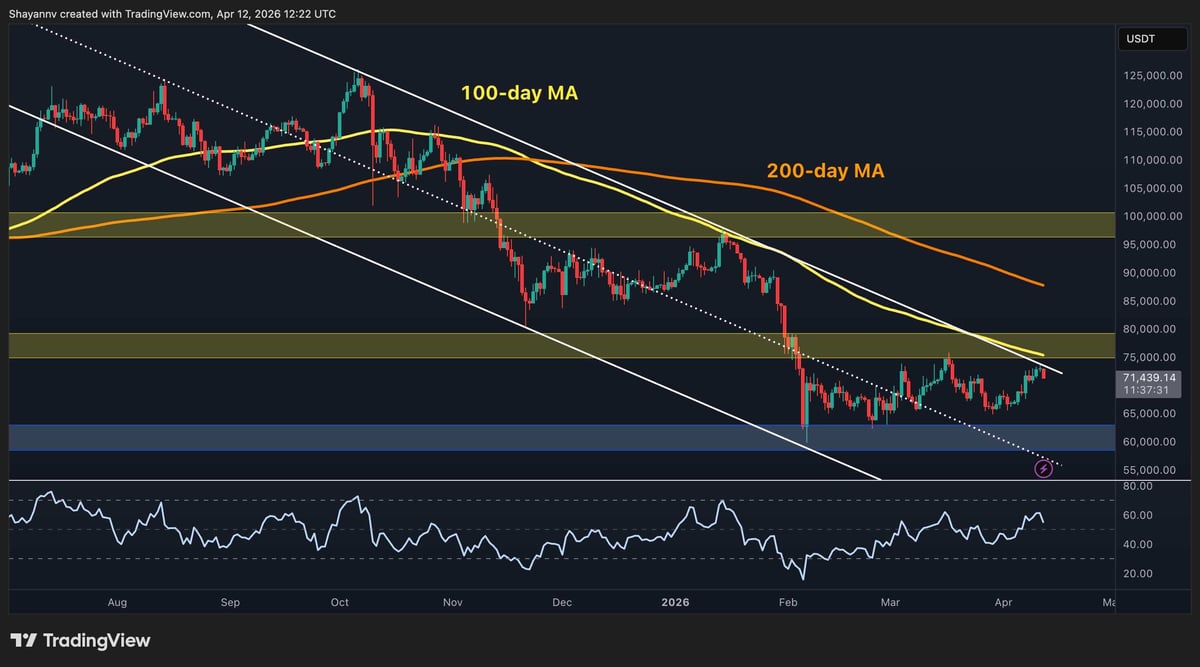
Bitcoin Price Evaluation: Daily Chart Insights
The daily chart indicates a persistent long-term downtrend. Bitcoin ($BTC) is situated within a descending channel and remains below both the 100-day moving average (around $75k) and the 200-day moving average (approximately $87k). The resistance zone between $75k and $80k continues to act as a significant barrier, having thwarted every recovery attempt since February’s market crash. Both moving averages are on a downward trajectory, suggesting that the overarching trend has yet to reverse.
However, it’s worth noting that the Relative Strength Index (RSI) has been climbing since reaching lows in February and is now above 50. This implies that buying momentum still slightly outweighs selling pressure. The critical support level at $60k must be defended by buyers; failure to do so could lead prices toward around $55k. Conversely, if Bitcoin manages to break through the resistance of $75-$80k with substantial volume behind it, this would serve as an initial indication of a trend reversal.
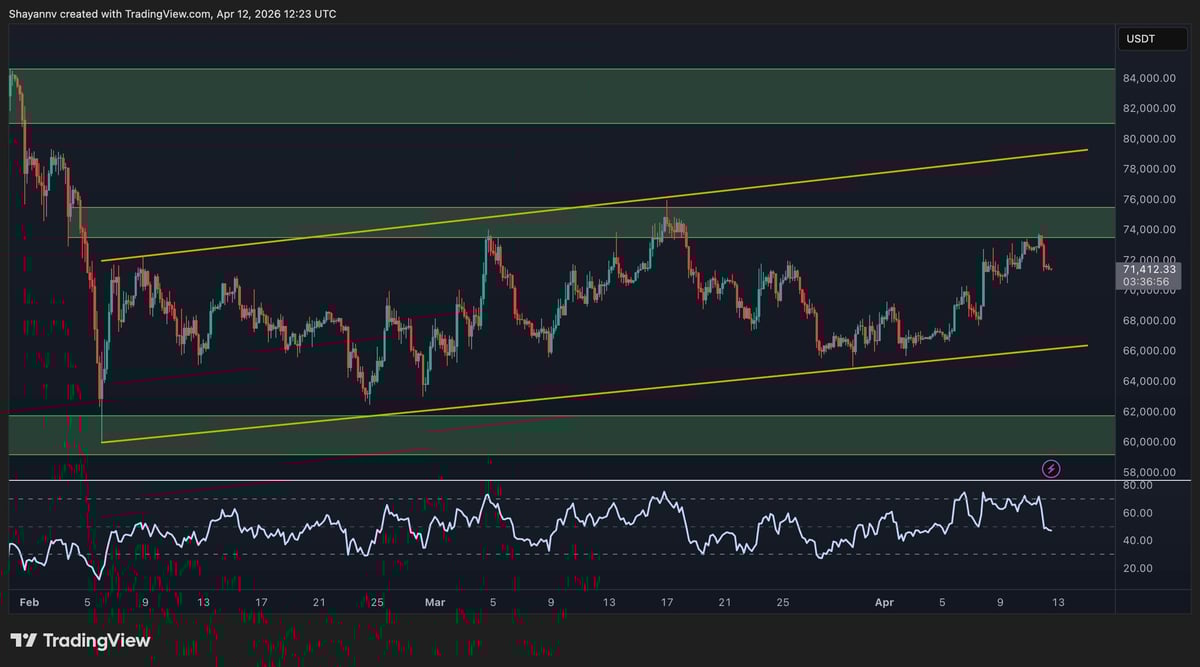
$BTC/USDT Four-Hour Chart Analysis
The short-term ascending channel established since February’s lows remains prominent on the four-hour chart with Bitcoin currently priced at around $71k. Recently, attempts to breach into the range of $74-$76k have been met with rejection from lower levels; thus there exists potential for revisiting lower boundaries near approximately $67k.
The RSI for this timeframe has significantly decreased and now sits below 50. While not deeply entrenched in bearish territory yet, this signals an impending shift towards bearish momentum in the short term.
A confirmed close above $75K would negate bearish expectations and potentially propel prices towards hitting around$80K levels again. On contrary note though—a more profound decline breaking below lower trendlines could raise concerns about returning focus back onto daily support zones near$60K.
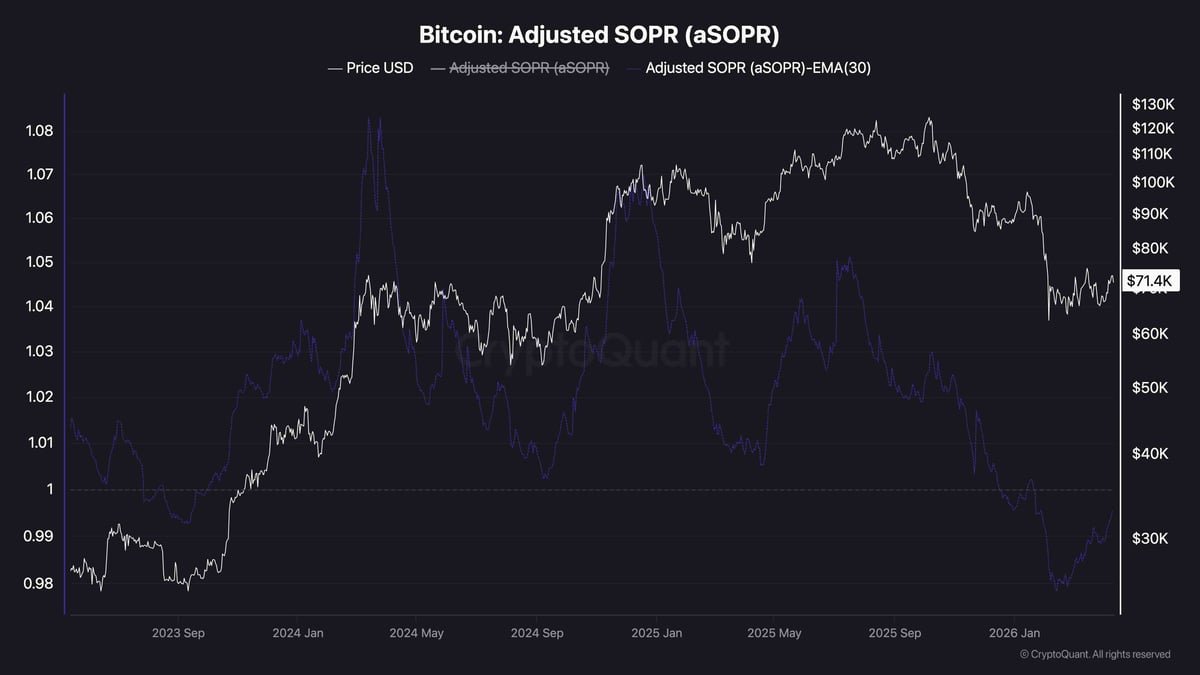
On-Chain Metrics Overview
The Adjusted SOPR (aSOPR) currently shows values falling beneath 1.00—indicating that coins are generally being spent at losses across aggregate transactions made during these price points . What stands out particularly about current readings is how much they mirror those observed when Bitcoin was valued roughly around$25K during last bear market’s concluding stages .
This suggests present-day realized loss behavior reflects capitulation intensity similar seen nearly three years ago when BTC hit cycle lows at considerably lesser valuations than today’s figures .
Historically speaking , prolonged periods where adjusted SOPR stays under one—especially coupled with EMA confirming such trends—have often marked late-stage capitulations rather than signaling fresh downturns ahead . However given prevailing geopolitical/economic contexts , we cannot guarantee imminent reversals will occur ; but evidence does hint sellers might be tiring out here which analysts look for while identifying bottom formations taking shape soon enough!