Bitcoin is currently fluctuating within a narrow range in the short term, while broader trends indicate that the market is still adjusting from previous highs. One analysis reveals that large investors are actively defending critical price levels on both ends. Simultaneously, another perspective suggests that Bitcoin is approaching its long-term fair value zone. Collectively, these insights highlight a market that has lost some momentum but has yet to determine its next direction.
In the immediate future, traders are closely monitoring whether Bitcoin can overcome significant selling pressure above or if it will lose support below. Additionally, longer-term regression models imply that the recent downturn has alleviated some of the earlier overheating in this cycle; however, this does not eliminate potential downside risks.
Bitcoin Remains Confined Within Whale Order Range
The price of Bitcoin remains constrained within a limited range as substantial order clusters influence trading on both sides. The CoinGlass chart indicates significant sell orders around $67,500 and again between $67,950 and $68,050. Meanwhile, buy support appears lower at approximately $65,600 to $65,800 with further buying interest near $64,900. Consequently, whale orders have kept prices locked within a tight boundary rather than allowing for any clear breakout.
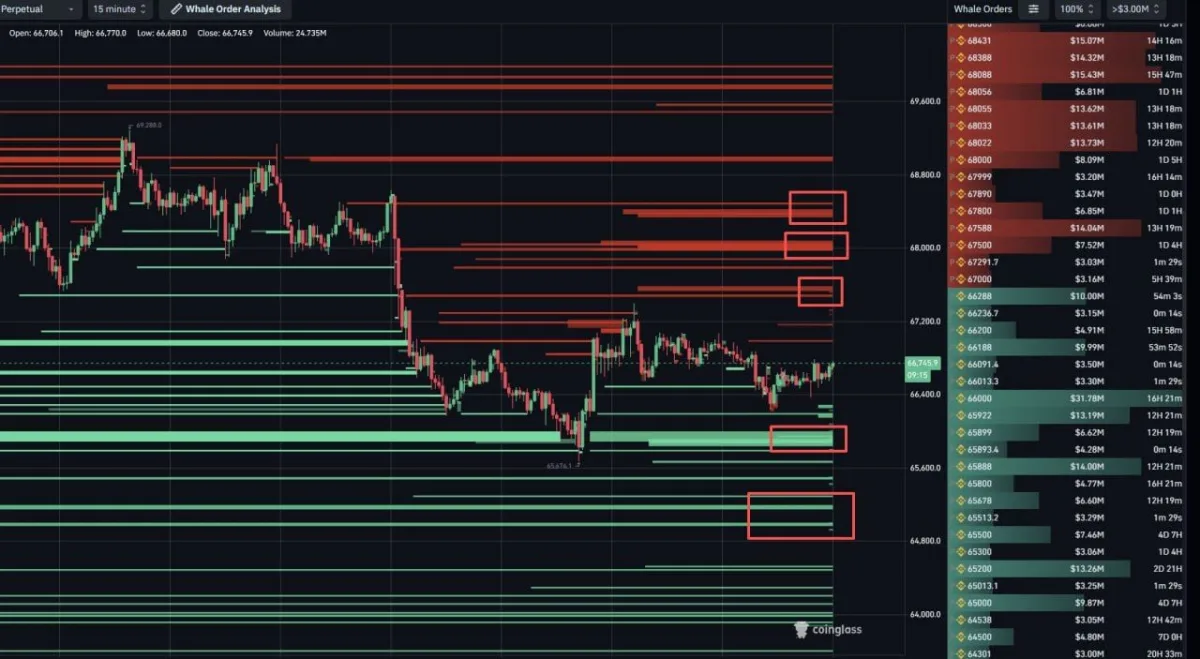
$BTC Whale Orderbook Update: Source: CoinGlass
Furthermore, this chart reinforces a view of short-term price stability rather than indicating an emerging trend. After experiencing a sharp decline followed by sideways movement where buyers and sellers maintained their positions near the midpoint of this range—marked by heavy resistance at upper red bands and potential buying opportunities in lower green zones—Bitcoin continues to be contained within this structure defined by whales.
The next directional move hinges on whether these large orders remain intact or dissipate entirely. A bullish scenario would likely necessitate buyers successfully overcoming sell walls around $67,500 and from $67،950 to 68،050 area; conversely,a bearish shift could occur if bids between $65،600 and 65،800 falter under selling pressure or get withdrawn altogether. Until clarity emerges regarding these dynamics,the current setup suggests continued volatility with whales maintaining control over price movements.
Bitcoin Approaches Midline as Log Regression Model Indicates Cooling Cycle
According to an analysis shared by More Crypto Online,Bitcoin has returned toward its long-term fair value zone after previously trading in an overheated region during earlier phases of this cycle.The log-log regression model places its midline around$63،000and indicatesthat Bitcoin is now hovering close tothis levelafter spending several months near higher ranges.This transition impliesthat partofthe prior excesshas already been absorbedbythe market.
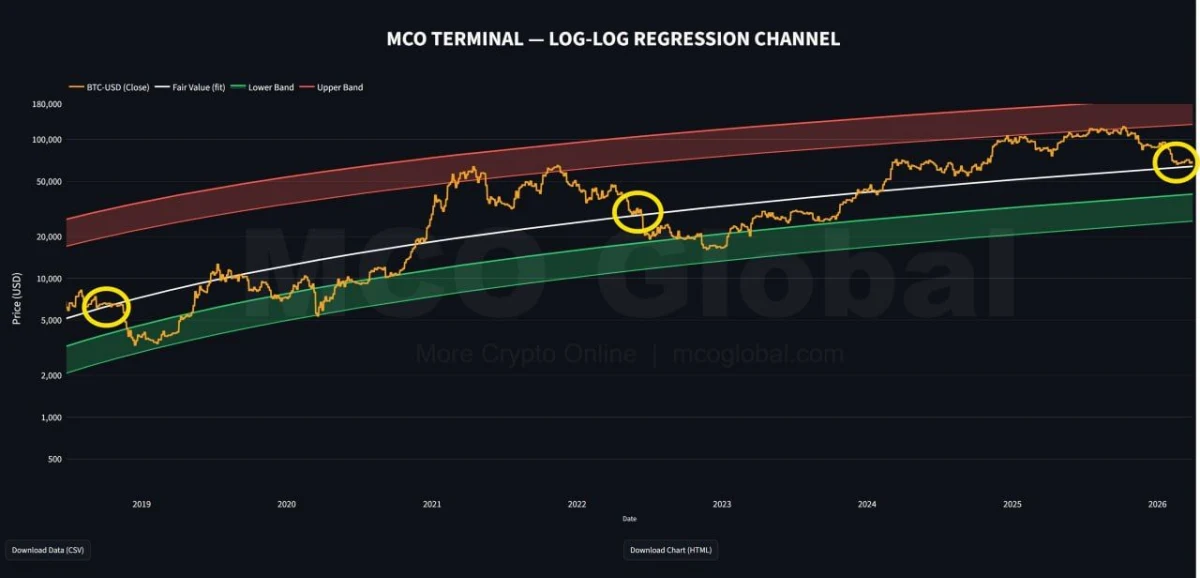
$BTC Log Log Regression Channel.Source: More Crypto Online
This chart tracks Bitcoin’s trajectorywithin along-termregression channel where white lines denote fair value while red zones signify upper extensionsandgreen areasindicate lower trend supports.In September when$BTCtradednearitsupperband,the model suggestedthatpriceshad becomeoverextended.Since then,Bitcoinhas corrected itselfand revertedto themidlinearea whichisnow framedas normalizationratherthananew breakout phase.
Additonally,past cycles depictedinthischart reveal how Bitcoinoften consolidatesaroundthismidlinetowarditsnextmajormovement.Nonetheless,this upcomingmovedoesnot automatically signalabullishtrend.The presentconfigurationstillleavesroomforpotentialdownsideespeciallyif$BTCfails tosustainstrongmomentumfromthefairvaluezone.As such,thismodeldoesnotindicateanendto correctionbutratherillustratesthat themarkethascooledofffromextremelevelswhilecurrentlytestingakeytrendregion.