Bitcoin is currently exhibiting two contrasting signals on its charts. One pattern indicates that a potential decline could be imminent, while the larger monthly configuration suggests that the market might already be approaching a significant bottom.
Bitcoin Chart Indicates Potential Risk in Mid-April as 68-Day Sideways Pattern Reemerges
A chart presented by Ted draws parallels between Bitcoin’s present formation and a previous setup that culminated in a steep drop following an extended period of sideways movement. In both instances, the price rose above an ascending support line, remained within a range for 68 days, and subsequently encountered substantial downward pressure. This analysis posits that Bitcoin may experience another downturn around mid-April if this pattern repeats itself.
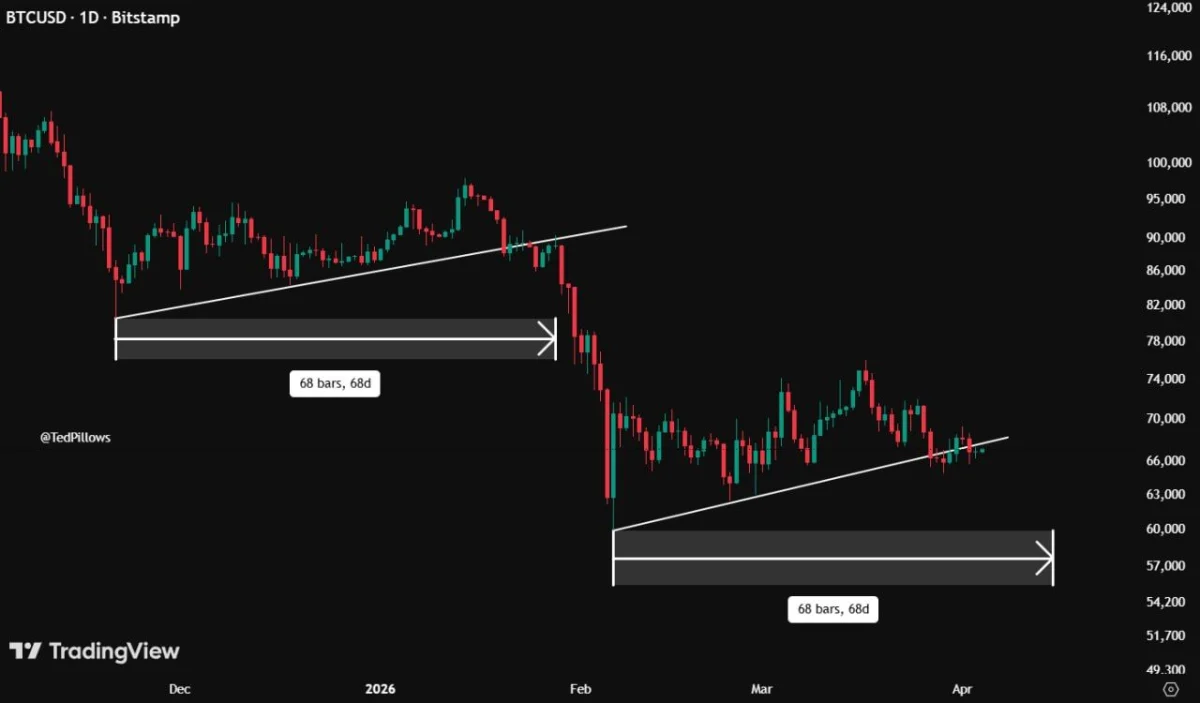
Bitcoin’s 68-Day Sideways Pattern. Source: Ted
This theory is primarily based on timing similarities rather than price alone. The initial structure on the left illustrates Bitcoin trading sideways for 68 days before breaking downwards. The subsequent structure on the right marks another similar duration ending around mid-April, suggesting time symmetry serves as a key indicator.
The ascending trendline also plays an important role here since prices are once again hovering near this rising support during this range phase. In the earlier example, selling pressure caused this support to falter; thus, there are concerns regarding whether buyers can maintain this structural integrity in light of potential selling pressures.
However, it’s essential to note that the chart does not definitively indicate an impending selloff. Similar timeframes can yield varying outcomes; recurring patterns do not guarantee identical results every time they occur. Therefore, while informative, these comparisons should be viewed more as cautionary indicators rather than conclusive evidence of an inevitable drop.
The gray areas flanking both sides of the chart appear to delineate prior consolidation zones and possible paths downward should weakness resurface in the market dynamics. This reinforces one clear message: although Bitcoin remains within a sideways phase at present, historical trends suggest such pauses have often led to negative outcomes previously.
The primary takeaway from Ted’s analysis is his belief in a potential recurrence of Bitcoin’s earlier downtrend setup with mid-April identified as another risk window ahead; however, any bearish scenario hinges upon whether current ranges break down similarly to past occurrences.
Alligator Indicator Suggests That Cycle Bottom May Be Approaching for Bitcoin
A different perspective comes from Titan of Crypto who employs the Alligator indicator over monthly intervals to juxtapose Bitcoin’s current status against historical market cycles. The crucial observation here is that during previous cycles when green lines crossed below red lines occurred close to significant bottoming points—this same crossover appears now indicating we might already be at or near cycle lows for Bitcoin.
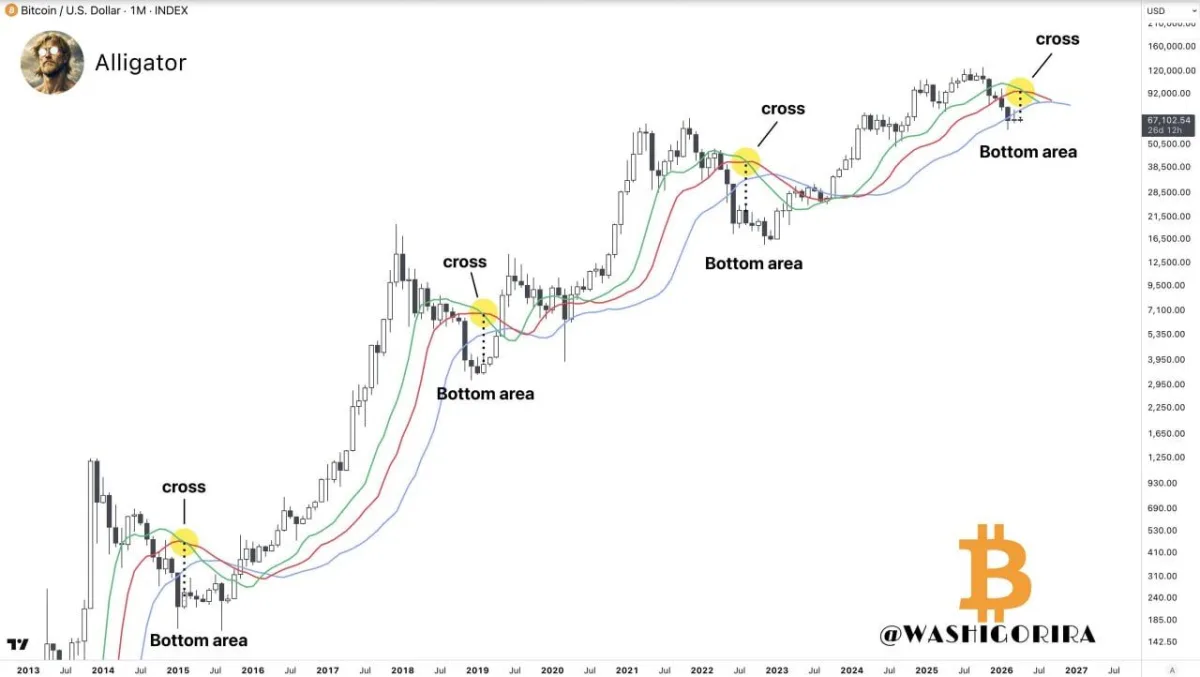
Bitcoin Alligator Bottom Signal Source: Titan of Crypto
This particular pattern holds significance because it underscores several past instances where such crossovers happened just before or coinciding with major bottoms forming phases leading into broader recoveries afterward—thus relying more heavily upon historical timing rather than short-term price fluctuations alone.
The “bottom area” markers indicated on these charts further reveal how crossovers did not always align perfectly with lowest candles but frequently emerged around wider zones where markets established their bases—implying signals may refer more broadly towards regions indicative of bottoms instead pinpointing exact turning points specifically.
Nevertheless no single indicator can confirm conclusively if we’ve reached our low point entirely yet; monthly signals provide valuable insights into larger cyclical structures but do not eliminate possibilities surrounding additional volatility or retests occurring thereafter hence supporting notions surrounding prospective bottom areas without guaranteeing full trend reversals occurring outrightly just yet!
Overall conclusion stands clear-cut: Current month-long Alligator crossover exhibited by bitcoin resembles similar indicators seen historically near prior cycle lows suggesting if patterns hold true once again then perhaps markets find themselves either firmly entrenched within ongoing stabilization phases instead embarking anew onto fresh declines ahead!