Bitcoin is currently valued at approximately $74,700, maintaining its position close to the peak levels observed since the downturn in February. The positive momentum that has developed over the last fortnight appears to be gaining traction.
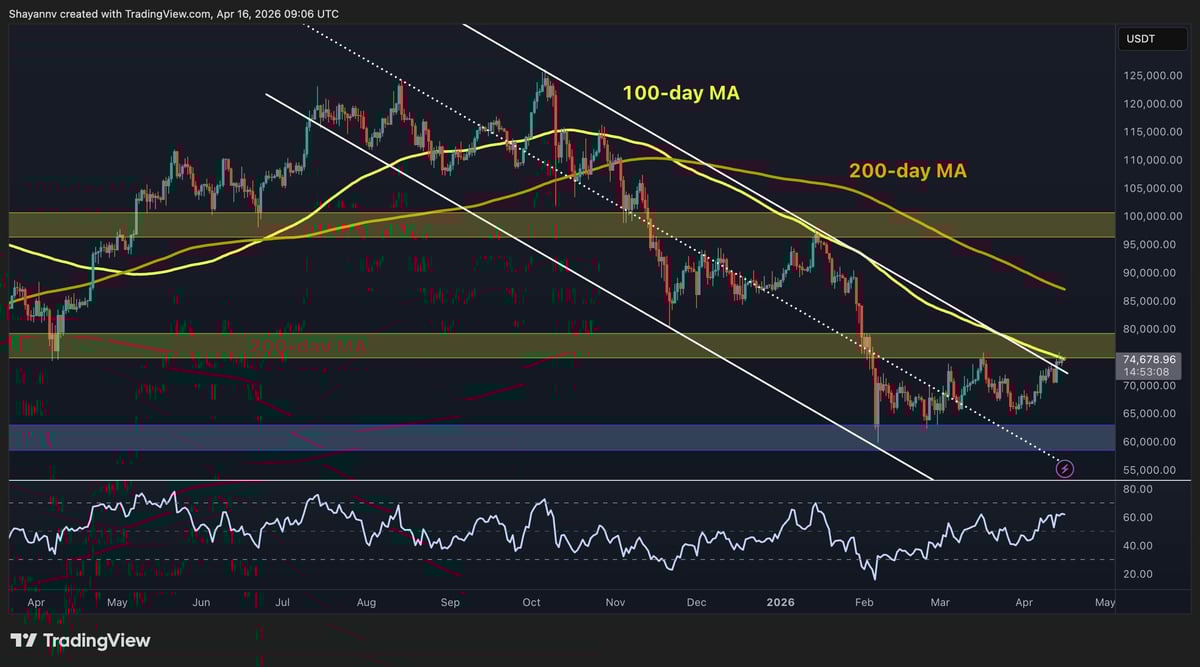
This upward movement is promising; however, $BTC finds itself at a crucial technical crossroads during this correction phase. It approaches a significant point where the upper boundary of a descending channel meets with the 100-day moving average—two pivotal levels that have shaped bearish trends for several months.
Bitcoin Price Evaluation: Daily Chart Insights
For the first time during this corrective cycle, $BTC seems to be making a genuine attempt to break out above its descending channel. The price has surged past the upper boundary around $74k–$75k while also surpassing the declining 100-day moving average nearby. Additionally, the RSI has risen into high-60s territory—the strongest daily momentum reading seen since before February’s crash—adding credibility to this breakout attempt without indicating overbought conditions.
The confirmation of whether this will result in a successful breakout or another failure hinges on how prices behave in upcoming daily closes. A sustained close above both the channel and resistance between $75k and $80k would signify an important structural shift and pave a pathway toward reaching between $88k and $90k, where it encounters further resistance from the 200-day moving average. Conversely, if there’s any breakdown from here, support at around $60k–$62k must be fiercely defended by buyers.
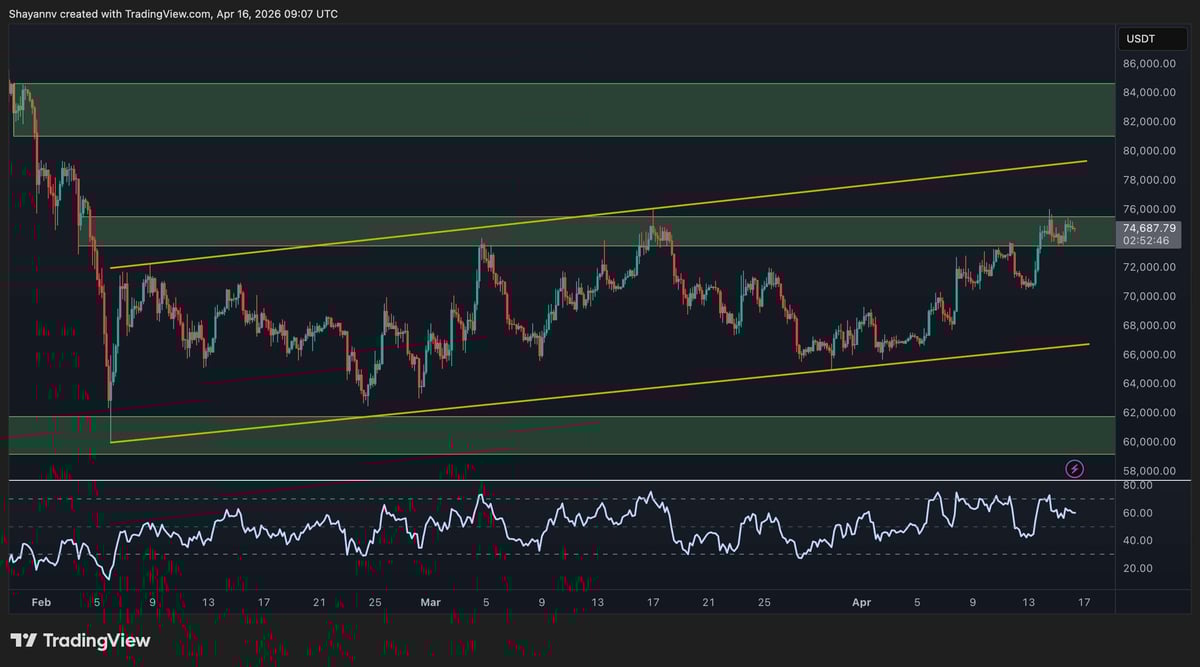
$BTC/USDT Four-Hour Chart Analysis
The four-hour chart indicates that $BTC continues trading within an ascending channel established since February’s lows. The price has now surpassed its midline and is striving to breach resistance within the range of $74-$76K. Meanwhile, RSI readings are hovering near 60s which allows for potential upward movement without immediate risk of rejection typically associated with previous attempts.
A clear breakout beyond $76K accompanied by RSI remaining above 60 would signal strong short-term bullish sentiment and could accelerate movements towards zones around $80K–$82K. Should there be any stagnation or pullback from current levels, watch closely for support near recent lows around $71K followed by lower boundary support at approximately $67K.
On-Chain Metrics Overview
The reserves of Bitcoin held on exchanges have dwindled down to roughly 2.68 million $BTC, marking their lowest level recorded since mid-2023—a stark drop from early 2024 when reserves peaked at about 3.2 million $BTC. This decline has been sharp and consistent throughout late 2025 even as prices fell significantly from their highs near $125K.
This data point carries considerable weight; with fewer Bitcoins available on exchanges than ever before in recent history—the sell-side supply appears structurally thinner than it was during previous years when $ BTC traded much lower . In scenarios where demand returns robustly , such limited exchange-side supply could significantly amplify upward price movements .
These conditions resemble those preceding past recoveries , wherein tightening supply combined with improving market sentiment created fertile ground for substantial moves . However , sustained demand remains essential . Nevertheless , what’s being built on-chain right now represents one of most constructive setups seen in years .
