
Bitcoin is encountering fresh challenges as one analysis reveals a pattern of selloffs following Federal Open Market Committee (FOMC) meetings, while another indicates a cluster of low liquidity that could drive prices down. These elements together imply that macroeconomic factors and leverage positions are influencing Bitcoin’s next movements.
Analysis Indicates FOMC-Related Selloffs May Impact BTC in 2026
According to analyst Ted Pillows, Bitcoin has experienced declines ranging from 6% to 30% after each of the last six FOMC meetings. His chart illustrates several significant pullbacks occurring between mid-2025 and early 2026, highlighting that post-FOMC weakness has become a recurring trend. Based on this data, he suggests that if Bitcoin were to decline by another 6%, it would hover around $67,000; conversely, a more severe drop of up to 30% could see it plummet towards $50,000 in the year ahead.
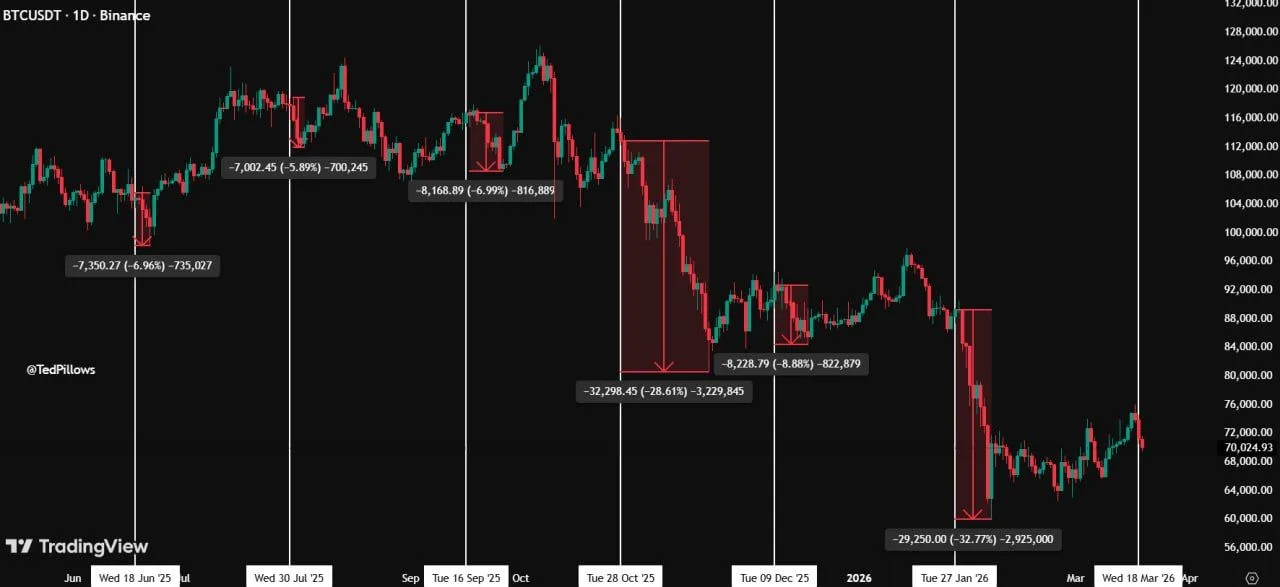
Comparison of Bitcoin’s Post-FOMC Drops: Source: Ted Pillow
The chart showcases various corrections clustered around FOMC meeting dates, revealing smaller dips between 6% and 9%, alongside two significant drops exceeding 28%. This trend indicates that macroeconomic events have consistently influenced short-term price movements for Bitcoin. While the chart does not guarantee similar outcomes will occur again in the future according to AP style guidelines, it does demonstrate traders’ tendency to mitigate risk surrounding Fed announcements—especially during periods when overall market sentiment is weak.
Nevertheless, these levels should be viewed as potential scenarios rather than certainties. A decrease toward $67,000 aligns with the lower range observed during recent FOMC-induced declines; however, falling to $50,000 would signify an even larger risk-off scenario. Consequently, this analysis positions the year ahead as one where Bitcoin may remain particularly responsive to signals from Fed policies and broader market dynamics.
Bitcoin Liquidation Heatmap Reveals Liquidity Cluster Acting as Price Magnet
The liquidation heatmap for Bitcoin highlights a substantial liquidity cluster forming at lower price ranges where high-leverage positions are concentrated. Such structures typically act like magnets since prices tend to gravitate towards areas with significant liquidation pools. The heatmap shows multiple past interactions with similar zones where prices entered these regions before either stabilizing or reversing direction.
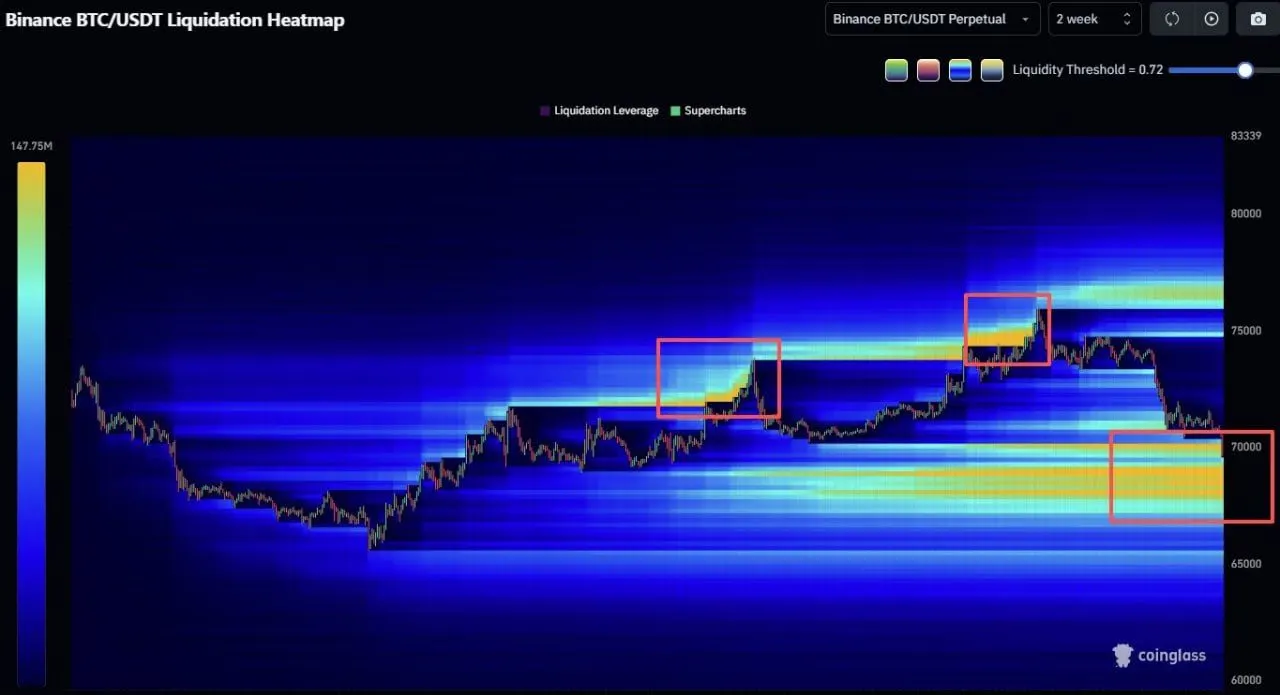
Bitcoin Liquidation Heatmap: Source: CoinGlass
Additionally, previously identified zones near local highs illustrate how liquidity accumulated above current price levels before sharp rejections occurred thereafter. This pattern underscores how leveraged positions can induce volatility in both upward and downward directions; when liquidity builds above current prices they may trigger upward movement until those liquidations occur—after which markets often pivot toward subsequent liquidity pockets.
The focus now shifts toward the highlighted lower band containing higher concentrations of liquidation levels remaining intact. This implies continued downside pressure until such liquidity is cleared away from the market landscape; thus framing current conditions more as driven by liquidity dynamics rather than merely trending movements—with pricing reacting predominantly based on areas where leverage concentration exists most heavily.