
Bitcoin is currently navigating a significant resistance zone following its most robust daily close in the past three months.
Nevertheless, $BTC must achieve a decisive breakout above the trendline resistance and overcome RSI pressure to validate stronger momentum.
The Unconfirmed Breakout of Bitcoin’s RSI
According to Elja’s shared chart of the 1-day BTCUSDT perpetual market, Bitcoin traded around $80,470. This chart illustrates that $BTC has rebounded from its February lows; however, it has yet to confirm a breakout above the ascending resistance line.
$BTC‘s recent recovery saw it rise from the lower $60,000 range towards $80,000. However, with the latest candle hovering near this trendline, Bitcoin still requires a solid daily close above this resistance level.
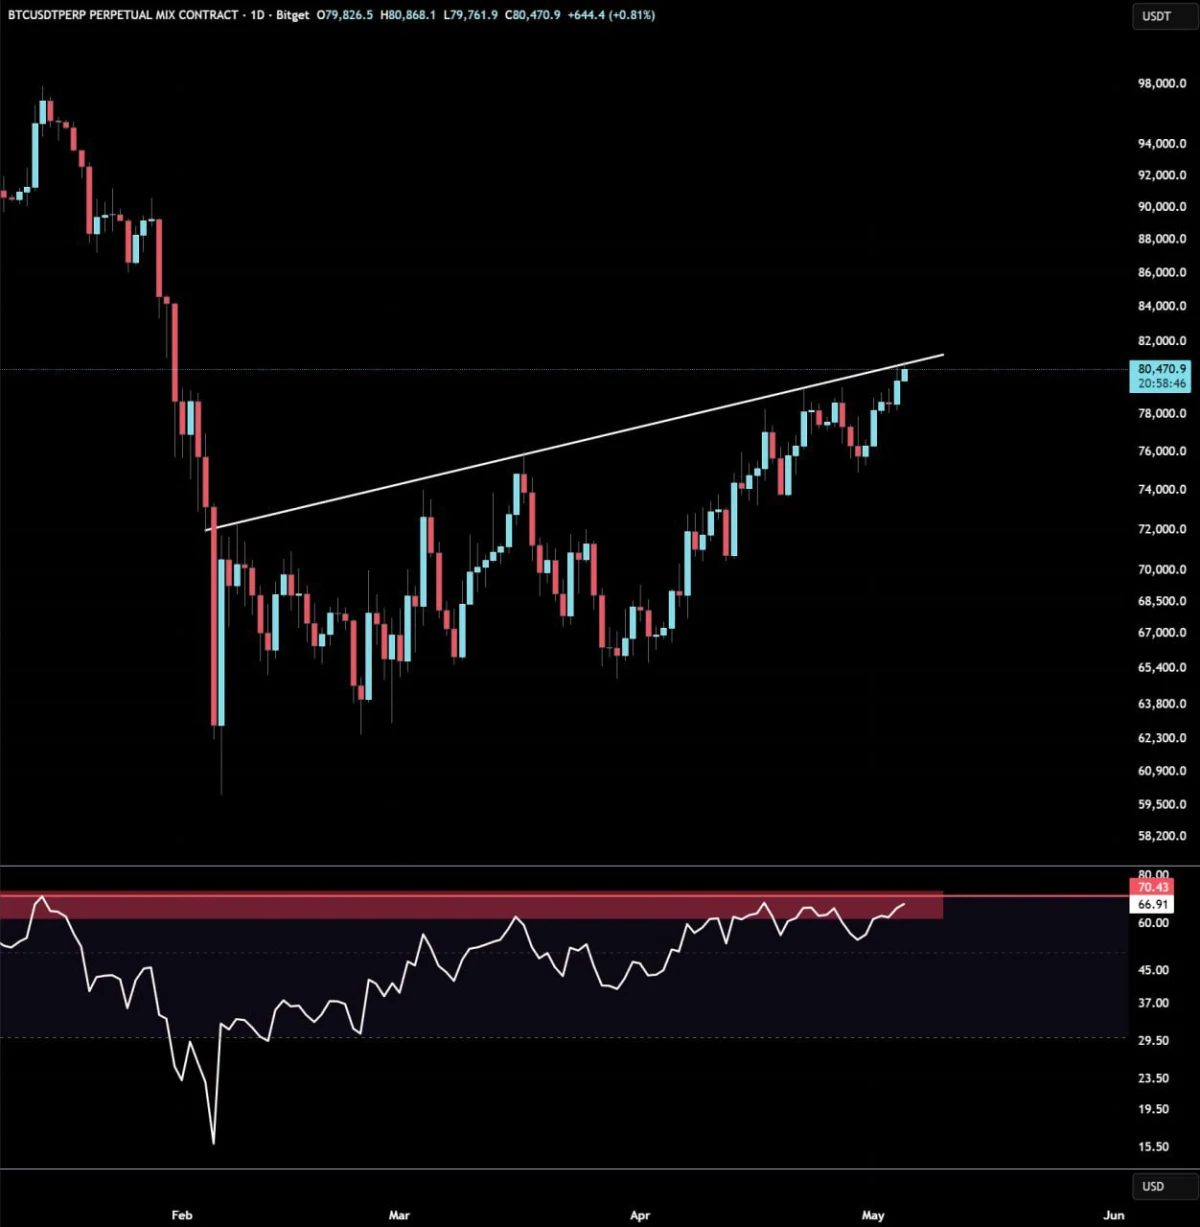
This is an illustration of Bitcoin’s RSI Resistance Chart. Source: Elja on X
The RSI indicates pressure near its upper resistance zone at approximately 66.91 while facing red resistance around level 70. This suggests that while momentum has improved significantly, it hasn’t yet entered a definitive breakout phase.
Elja noted that Bitcoin continues to face challenges against RSI resistance. The accompanying chart supports this perspective as it shows multiple tests of this upper zone without any substantial movement beyond it.
This situation is crucial because both price and RSI are nearing key areas of resistance. A successful break above both trendline and red zone would provide buyers with stronger confirmation for further bullish activity.
At present, indicators suggest that Bitcoin remains in a recovery phase rather than confirming an outright breakout; thus far,$BTC needs more robust momentum beyond both price and RSI resistances for structural change—until then,$80k remains pivotal support worth monitoring closely.
$BTC Tests Trendline Resistance After Achieving Three-Month Closing Highs
$BTC recently marked its highest daily closing figure in three months according to Super฿ro’s shared daily chart which depicts how $ BTC has been recovering since February’s sell-off while approaching rising diagonal resistances situated within low-$80k ranges .
This upward movement follows steady rebounds originating from lower-$60k levels during late February through March where consecutive higher lows/higher highs indicate short-term strength gaining traction.

The accompanying image illustrates bitcoin’s three-month closing high trajectory.Source:Super฿ro on X
$ BTC is now confronting critical levels once again.The white trend line visible across recent candles coincides closely with corresponding positions held by moving averages over two hundred days , rendering current conditions vital for validation purposes.
$ BTC , observed over one billion dollars flowing into spot ETF products within just two days.Such inflows could bolster demand as they signify fresh capital entering into these offerings. < Stronger bullish setups require clean closes exceeding both identified trends along with nearby moving averages before confirming any potential upside breakthroughs. If such resistances are cleared successfully next watch points will hover around mid-$$$80000 ranges otherwise retests may occur back downwards toward previous breakouts ranging between $$78000-$$80000 prior attempts upwards again being made thereafter. </ulFAQ: