Bitcoin is continuing its upward trend, but the market is nearing a crucial technical decision point. After maintaining stability around the $60,000 mark and establishing a series of higher lows, $BTC has climbed back into the low-$70,000 range, showing signs of improving short-term momentum. However, the overall market structure has not completely shifted to a bullish stance yet; thus, this movement should be interpreted as a resistance test until further confirmation is obtained.
Bitcoin Price Overview: Daily Chart Insights
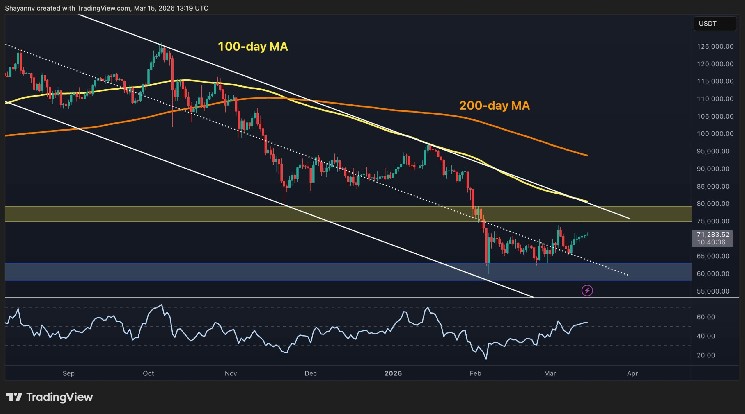
The daily chart indicates that Bitcoin remains below both its 100-day and 200-day moving averages, which keeps the long-term trend on alert. The price continues to operate within a broader descending pattern despite recent rebounds that have notably improved conditions compared to the panic sell-off witnessed near February’s lows.
A critical level to monitor lies in the $75,000 to $80,000 resistance zone—previously functioning as support before transforming into supply. As long as $BTC trades beneath this area, any upward movement can still be viewed as part of an overarching corrective phase. On the downside, maintaining support in the $60,000 to $62,000 range remains essential for buyers who wish to uphold this recovery trajectory.
$BTC/USDT Four-Hour Chart Analysis
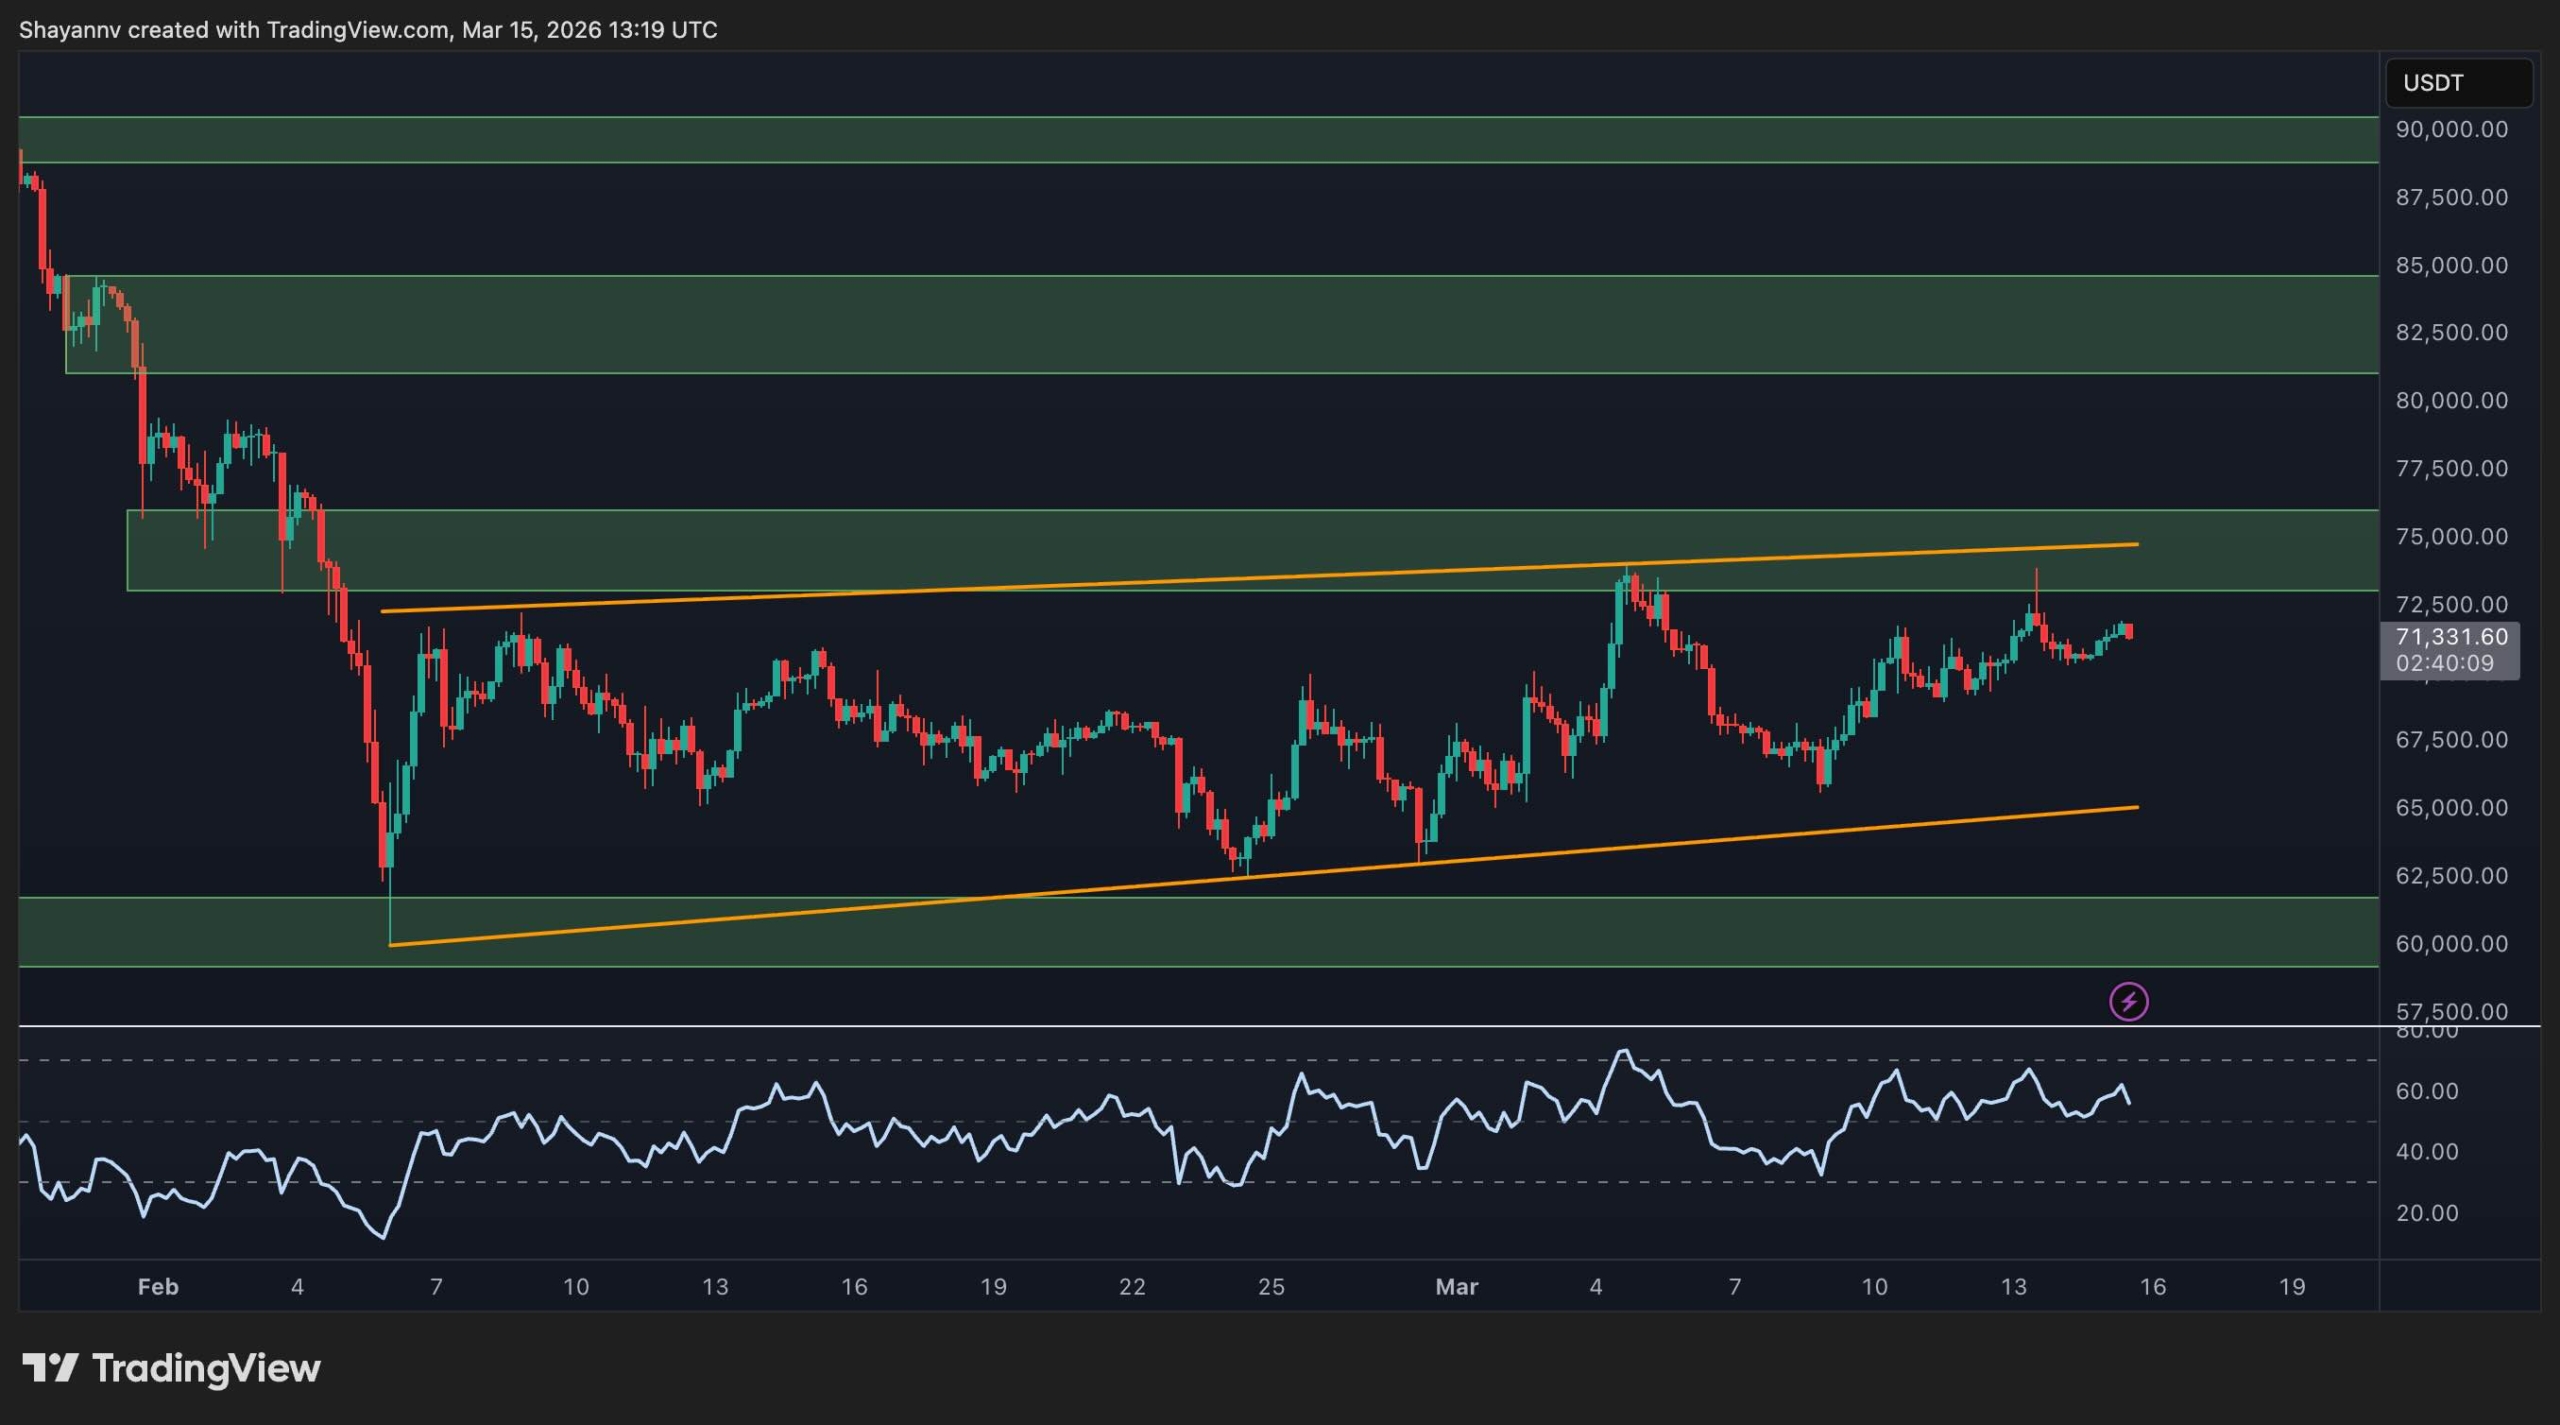
The four-hour chart presents a more robust outlook for Bitcoin. It has been ascending within an upward channel and is once again approaching its upper boundary. Currently trading between $71,000 and $72,000 with RSI indicators strengthening in their upper half reflects positive short-term momentum.
However,$BTC finds itself nearing an important confluence zone where channel resistance coincides with horizontal supply levels around $73K-$75K. This area holds significant importance; successfully breaking above it would bolster prospects for continued gains toward higher resistances while failing could push prices back toward mid or lower channel levels—maintaining market consolidation.
On-Chain Insights
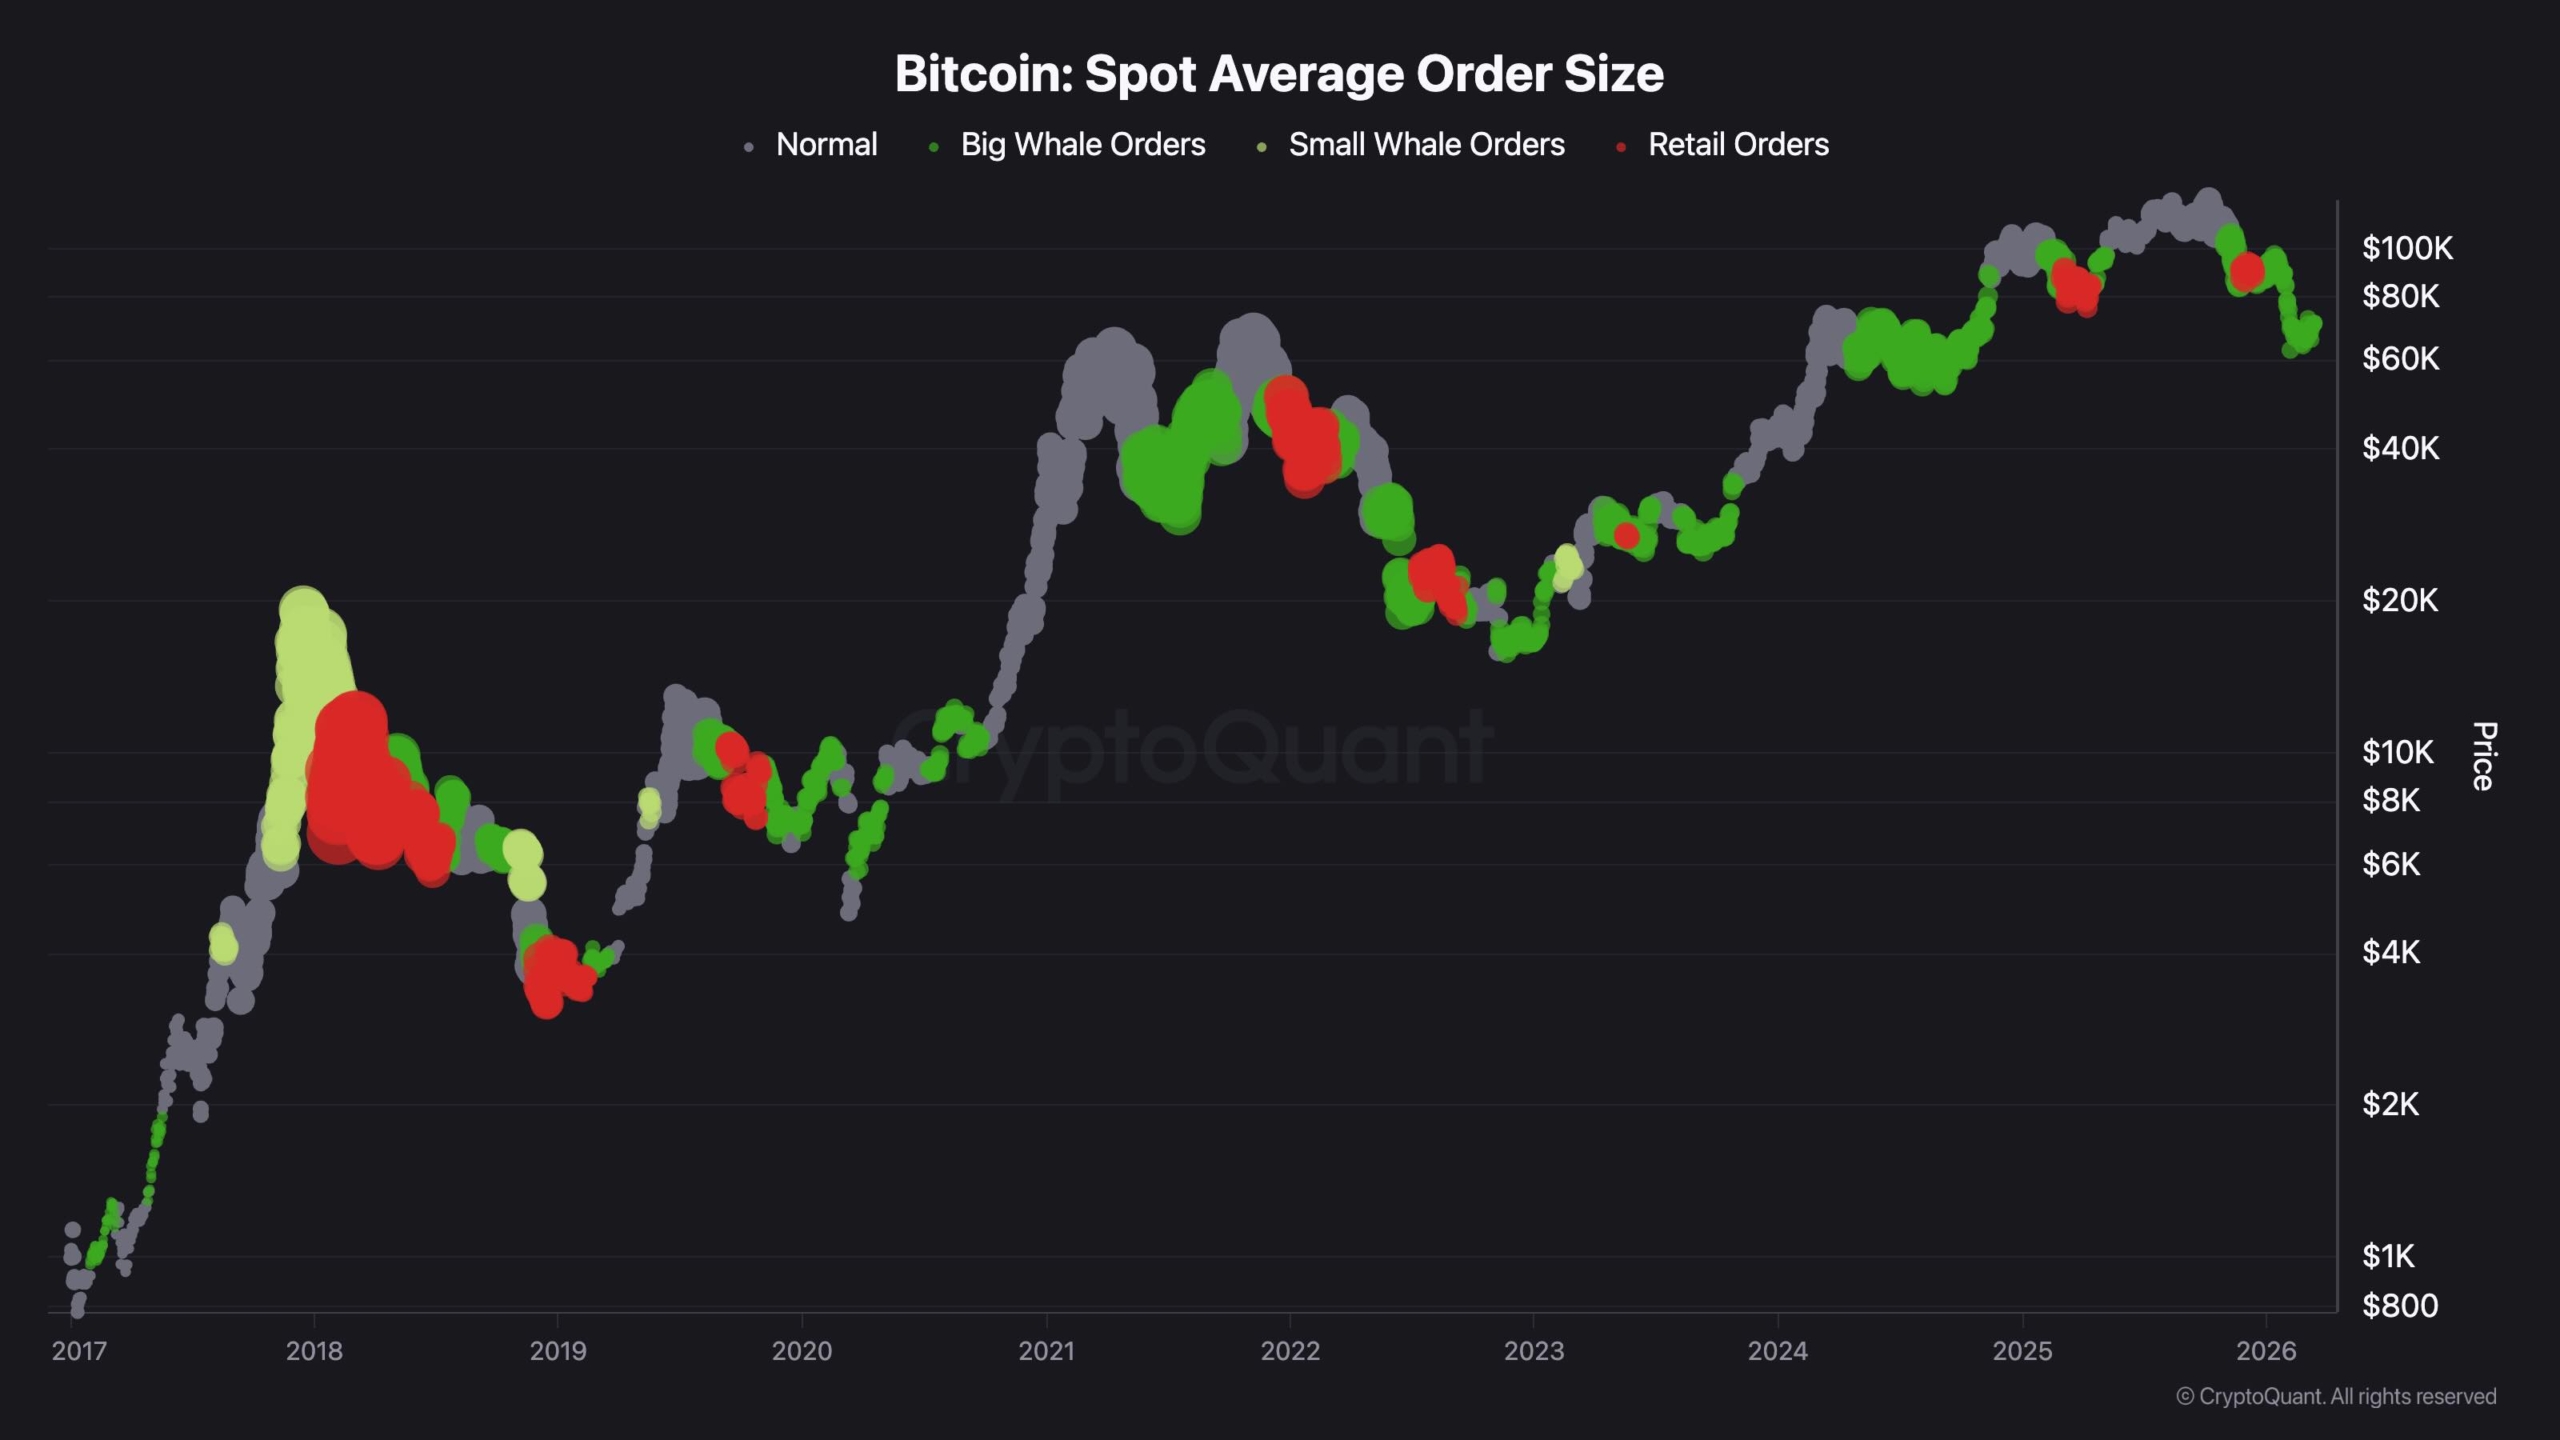
The on-chain analysis reveals a more optimistic perspective regarding Bitcoin’s activity trends. The Spot Average Order Size chart indicates that recent movements are primarily influenced by larger participants rather than aggressive retail traders typically seen during euphoric buying phases. Historically speaking,this scenario tends towards healthier dynamics than those driven solely by small-scale investors since it implies stronger hands remain active even when prices dip below cycle highs.
Additively,the data does not exhibit signs of widespread retail excitement usually linked with late-stage blow-off scenarios—which suggests that current recovery appears relatively stable from an on-chain participation viewpoint.So while Bitcoin encounters significant technical resistance zones depicted on charts,the order-size metrics imply that we have yet entered into fully overheated territory within this market context.