The forecast for Bitcoin’s price is currently divided between a potential cycle low ranging from $50,000 to $63,000 and a short-term breakout scenario aiming for $71,600. While analyst Plan C suggests that the most severe decline might have already occurred, Captain Faibik’s chart analysis reveals a descending channel that could break upwards if resistance levels are overcome.
Plan C Identifies $50,000 to $63,000 as Crucial Drawdown Range for Bitcoin
Market commentator Plan C believes Bitcoin may have already experienced the deepest drop anticipated in this cycle. He argues that the downturn could be much less severe than the 80% to 90% declines seen in previous cycles. In a recent post on X (formerly Twitter), he stated his expectation of a maximum drawdown around 50% to 60%.
This estimated range is calculated from Bitcoin’s all-time high and corresponds to roughly between $50,000 and $63,000. He noted that Bitcoin has already traded within this zone and expressed openness to the possibility that the lowest point of this cycle might have been reached as early as 2026.
Additionally, Plan C does not anticipate adherence to the traditional four-year market cycle pattern which typically predicts major lows during Q4 of each year. Looking forward, he emphasized his attention on upcoming Purchasing Managers’ Index data as an important indicator of business cycles expected soon.
Bitcoin Targets $71,600 Amid Falling Channel Formation on BTCUSDT 30-Minute Chart
On another front, crypto analyst Captain Faibik forecasts an imminent bullish rally with a near-term target set at approximately $71,600. In his update posted on X platform,the BTCUSDT 30-minute chart displays technical patterns suggesting upward momentum may be forthcoming.
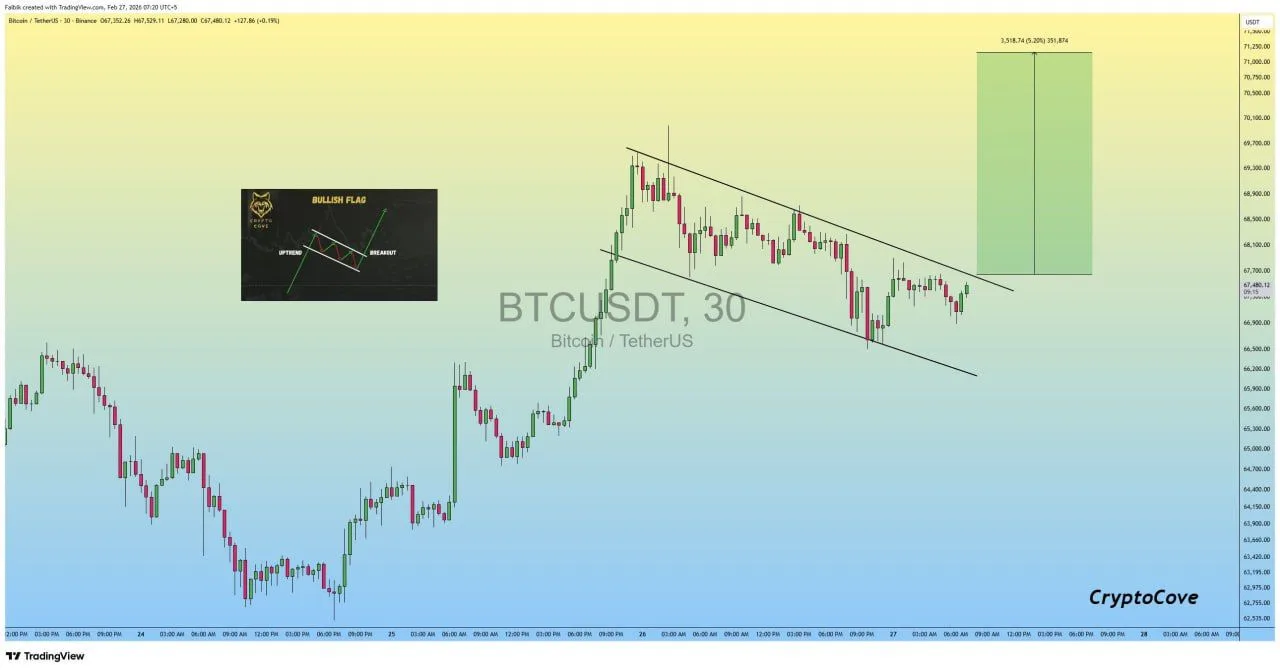
The BTCUSDT pair shown here represents Bitcoin against Tether US: Source: Captain Faibik via X
The chart illustrates Bitcoin trading within a downward sloping channel following an initial strong upward surge. After climbing sharply earlier in the session,BTC entered into consolidation characterized by lower highs and lower lows confined between parallel trendlines.At present,BTC hovers near$67,480 while attempts at breaking above are capped by resistance along the upper boundary of this channel.
If price manages to break out beyond this descending resistance line with conviction,Fabik projects it could push toward$71,600.
A highlighted measured move box above current levels indicates room for extension toward previous highs around$70,000–$71,000 region.Nevertheless,the structure remains classified as short-term corrective until sustained momentum clears above these trendlines after earlier gains.