Bitcoin is currently conveying two distinct messages across different timeframes. The daily chart indicates a breakout above a prolonged downtrend line accompanied by increased trading volume, while the monthly RSI chart implies that the overall cycle may require a more significant reset before establishing a definitive bottom.
Bitcoin Surpasses Daily Downtrend Line with Increased Volume
The daily BTCUSD chart illustrates Bitcoin’s rise above an extended descending trendline that has constrained its price since late 2025. SuperBro asserts that this breakout appears convincing due to the heightened volume accompanying it, and he points out that in 2022, a similar breakout did not occur until October.
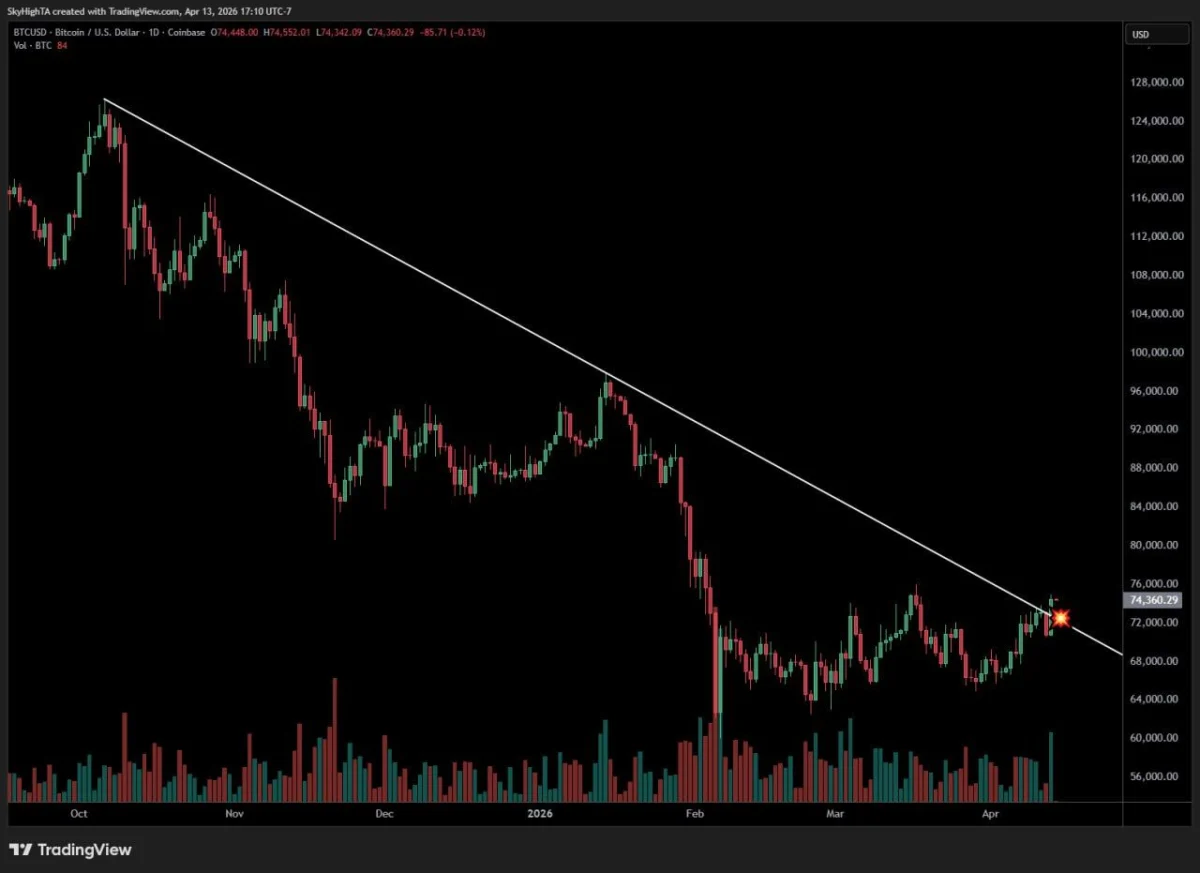
BTCUSD Daily Chart Featuring Linear Downtrend Breakout. Source: SuperBro on X
This analysis reinforces his perspective. Bitcoin lingered for months beneath a clear linear downtrend characterized by lower highs along the white resistance line. Now, prices have surged past this trendline in the $72,000 to $74,000 range. Concurrently, trading volume has risen significantly, lending more credibility to this breakout compared to quieter movements above resistance levels.
This development is crucial because breakouts from trendlines accompanied by rising volumes often indicate shifts in market dynamics. Sellers had successfully defended this slope for an extended period; however, recent candles demonstrate buyers overcoming it. Nevertheless, one candle signaling a breakout does not ensure an entire trend reversal; traders typically await confirmation of sustained prices above the broken line before considering continuation.
The comparison with 2022 provides additional context here. During that period, Bitcoin remained under its broader downtrend for much longer before eventually breaking free later in the year. This suggests that $BTC might be exhibiting relative strength earlier within this cycle than previously observed. If prices maintain their position above the trendline following this breakout attempt, it could signify the onset of a wider recovery phase; conversely, if they dip back below it could result in what is known as a false breakout.
Monthly RSI Indicates Potential Bottom Zone Around 2026
This BTCUSD monthly chart emphasizes RSI trends throughout various market cycles. Ted Pillows posits that Bitcoin’s monthly RSI might reach another low point around 2026 and suggests this timeframe could coincide with forming its next bottom.
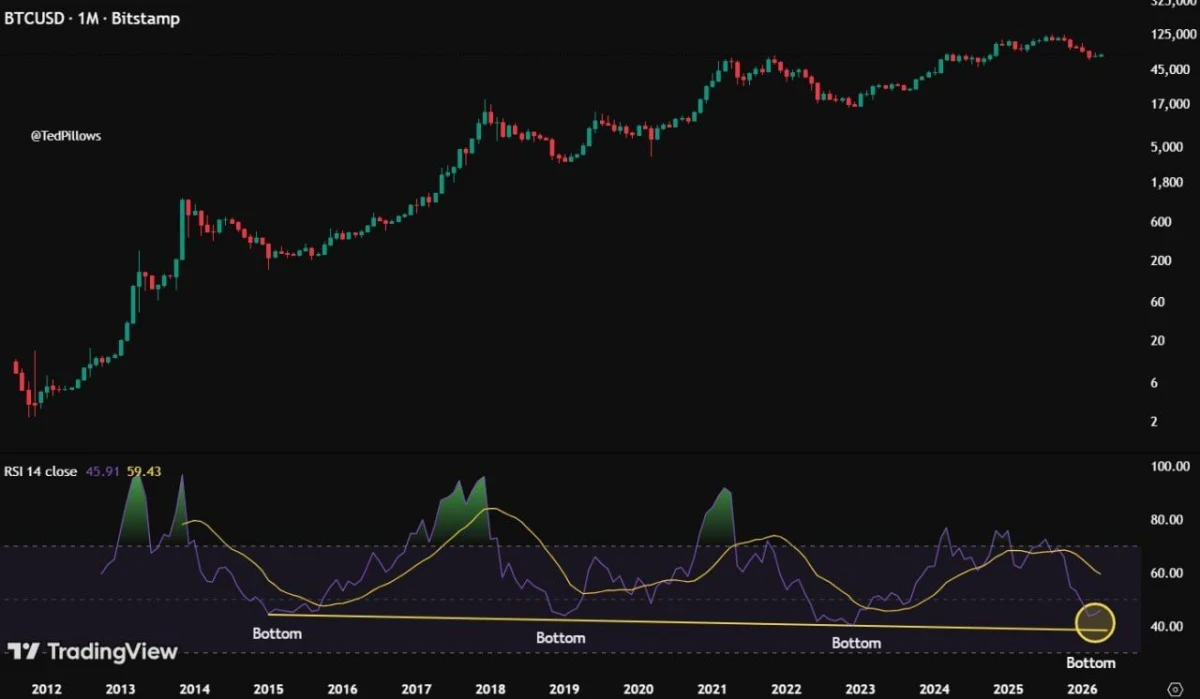
BTCUSD Monthly Chart Highlighting RSI Cycle Bottom Comparison Source: Ted Pillows on X
The data reveals consistent patterns across previous cycles where each significant bear market bottom for Bitcoin occurred when monthly RSIs dipped into lower territories near or below 40—these earlier lows are marked on charts from years like 2015 and 2018 through to 2022 now showing current RSIs trending downward again towards these same levels highlighted at far right side of current data set.
This information holds significance as monthly RSIs serve as long-term momentum indicators rather than tracking short-term price fluctuations—they illustrate periods when overarching market weakness may be nearing exhaustion points during prior downturns where deep resets aligned closely with major lows even amid volatile pricing surrounding those bottoms themselves!
If indeed we observe further declines leading up toward marked support zones around mid-2026 per Ted Pillow’s analysis—it would align perfectly within established historical patterns! However keep in mind simply relying solely upon RSIs won’t provide exact dates indicating bottoms—we must also consider price structures macroeconomic conditions & reactions occurring around such critical thresholds before declaring full cycle lows officially confirmed!