Bitcoin is currently experiencing potential downside risks prior to any significant recovery, as highlighted by two market analysts who indicate a fragile structure and incomplete liquidity beneath the existing price level. Their analyses illustrate a market caught between lower support levels and persistent resistance challenges, lacking definitive indicators of a sustainable trend reversal.
Potential for Bitcoin to Dip Before Rebounding
According to trader Ted Pillows’ chart analysis, Bitcoin might revisit lower liquidity zones before making another upward movement.
Ted pointed out that Bitcoin has yet to fully address its downside liquidity. He also observed that liquidity clusters are forming above the $75,000 mark. Consequently, this setup implies that Bitcoin could initially decline in the short term before eventually rising again.
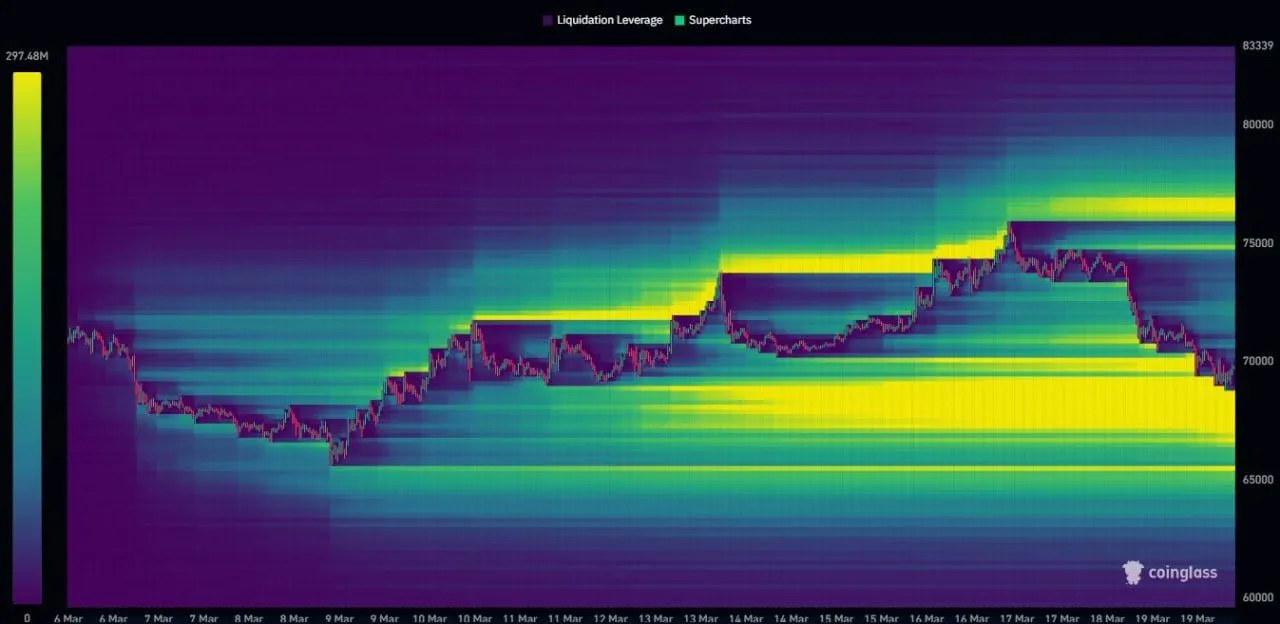
The chart illustrates significant concentrations of liquidity below the current price range, particularly within the $66,000 to $69,000 bracket. Simultaneously, another cluster appears around and above $75,000. Thus, this structure indicates two active zones where price movements may occur.
In such scenarios, downside liquidity often acts as an attractor prior to a reversal. Therefore, if sellers maintain pressure on the market first targeting those lower areas seems plausible for Bitcoin. If buyers re-enter afterward it may lead prices toward higher clusters above $75K.
However timing remains unconfirmed by this chart; it merely indicates where liquidation interest is accumulating and potential future price movements. Currently it’s essential to note that Bitcoin finds itself sandwiched between substantial liquidity below and new formations overhead.
Persistent Resistance Signals Ongoing Downward Pressure
An analysis from Daan Crypto Trades reveals that Bitcoin continues facing rejection at critical resistance points reinforcing an overarching downtrend structure.
Daan remarked on how repeated failures in breaking through ranges make sustained relief rallies improbable; every attempt at upward movement has met with rejection confirming active selling pressure at these resistance levels resulting in insufficient establishment of stronger bullish structures for prices thus far.
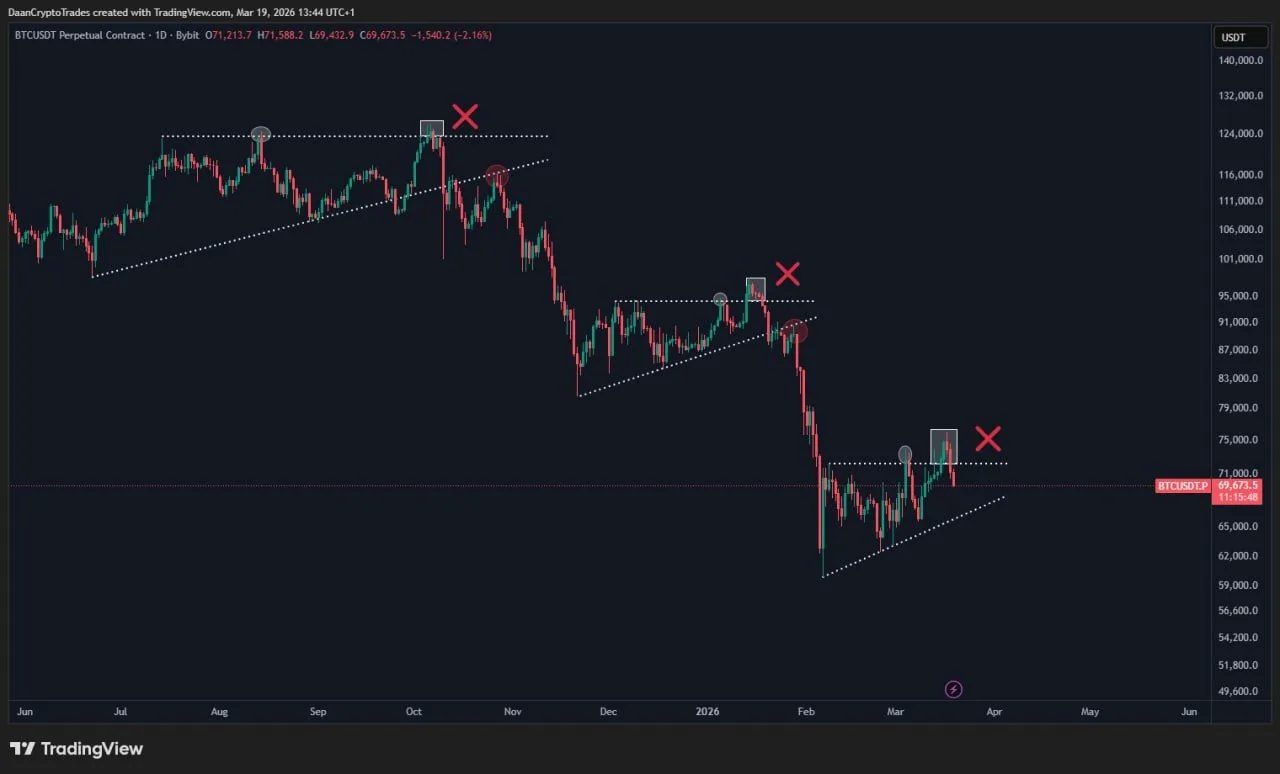
The accompanying chart displays multiple failed breakout attempts characterized by declining highs alongside rejections near horizontal resistance lines while ascending trendlines across shorter timeframes continue breaking downwards indicating no translation into meaningful trend reversals despite short-term strengths observed recently.
Daan further noted recent fluctuations primarily reflect short squeezes followed closely by ongoing declines—these sweeps trigger temporary surges but fail to sustain themselves leading back towards lower pricing once overhead liquidations have been cleared away entirely.
Additively ,the current behavior exhibited within bitcoin’s pricing actions remains erratic across shorter timeframes persisting over approximately six weeks now limiting clear directional shifts hence maintaining instability without confirmed transitions into new trends ahead .