
As of today, Bitcoin’s price hovers around $87,500 amidst a turbulent Christmas week characterized by a sudden market drop, significant derivatives expiration, and ongoing technical pressure beneath crucial moving averages. Despite the surrounding chaos, the price remains confined within a narrow compression zone; buyers are maintaining support but have yet to regain control of the trend.
The Flash Crash: A Microstructure Incident Rather Than Market Collapse
On Christmas Eve, panic ensued when Bitcoin briefly dipped to $24,111 on Binance. This drastic move represented an astonishing drop of over 70 percent in mere seconds and quickly gained widespread attention. However, context is key.
This crash was isolated to the BTC/USD1 pair—a low-volume market associated with World Liberty Financial’s USD1 stablecoin—while major pairs like BTC/USDT and BTC/USDC remained stable around $86,400 during this incident.
The thin liquidity during holiday trading conditions contributed significantly to this event. A promotional offer from Binance providing 20 percent interest on USD1 attracted buyers who depleted the order book. When a substantial sell order came through without sufficient bids to absorb it, prices were forced down rapidly to execute the trade. Arbitrage desks corrected this discrepancy almost immediately.
This occurrence highlighted vulnerabilities in order books during quieter trading hours rather than indicating any decline in Bitcoin’s fundamental demand or overall sentiment.
A Descending Trendline Continues To Shape The Market
BTC Price Action (Source: TradingView)
On daily charts, Bitcoin remains constrained under a descending trendline that has dictated lower highs since its peak in November. Each attempt at recovery has faltered below this line confirming that sellers still dominate rallies.
The current price trades below all significant EMAs—the 20-day EMA is near $88,500; the 50-day EMA is around $92,400; while both the 100-day EMA sits close to $98,100 and the 200-day EMA just above $101K—creating an environment where overhead supply persists and explains why rebounds tend not to last long.
The Supertrend indicator also remains bearish near approximately $95K; until Bitcoin can reclaim this level successfully again indicates that broader trends favor continuation instead of reversal.
Fibonacci Levels Indicate The Compression Zone
Fibonacci retracement levels drawn from October’s high down through November’s low accurately frame today’s range for Bitcoin pricing as it hovers just above its 0.236 retracement level at about $86K which has served as short-term support throughout December thus far.
Sitting above current prices are resistance zones marked by Fibonacci levels at approximately$90K (0.382) and about$93K (0.5), closely aligning with declining EMAs creating tight confluence areas for supply pressure ahead if breached upwardly.
If prices fall below$86k next critical support lies nearer$80k which marks last month’s lows indicating potential deeper corrections ahead if broken decisively downwardly .
The Impact Of Options Expiry On Price Stability
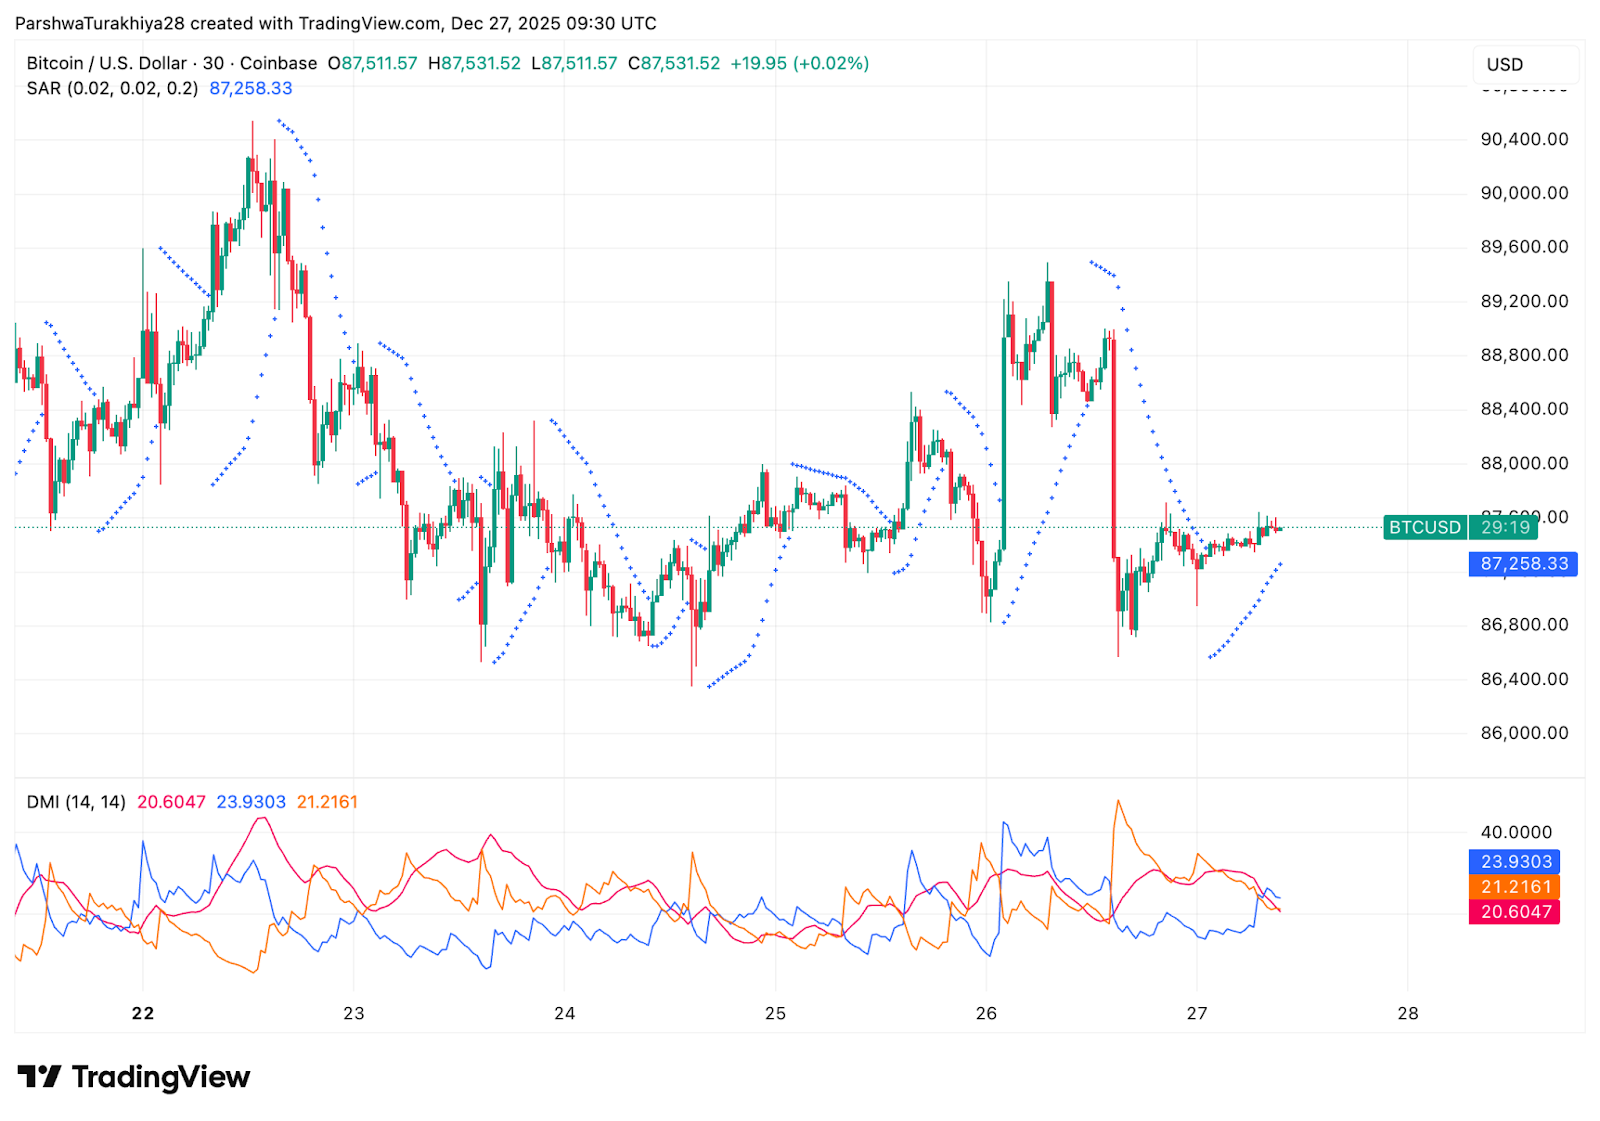
BTC Price Dynamics (Source: TradingView)
Pivotal mechanics surrounding derivatives played an essential role throughout December regarding muted pricing actions observed across markets wherein roughly27 billion dollars worth options related primarily either bitcoin or ethereum expired post-Christmas day marking one largest year-end settlements recorded thus far!
Around23 billion dollars solely attributed towards bitcoin across268 thousand contracts—with maximum pain threshold hovering near95 thousand reflecting heavy call positioning among traders present throughout duration!
Diving deeper into December reveals how consistently fluctuating between85 &90k kept dealers hedging exposure aiming delta neutrality suppressing volatility ultimately leading thirty days implied volatility plummeting sharply dropping from63% down closer42%.
No longer bound by expiry constraints now allows more organic fluctuations driven purely via real supply-demand dynamics emerging henceforth unlocking potential expansion possibilities ahead!
Lack Of Directional Bias In Lower Timeframes Indicates Indecision Rather Than Capitulation
An analysis based upon30-minute charts shows consolidation occurring between87 &88 k following failed attempts bouncing back towards89 k earlier witnessed previously! While parabolic SAR flipped slightly supportive momentum itself appears weak presently still lacking definitive directionality however;
DMI readings further reinforce absence strong trending dominance showcasing coiling nature prevailing instead signaling possible expansions soon approaching although without clear directional bias existing currently !
Main takeaway here illustrates sellers refraining pressing aggressively whilst buyers hesitate stepping forth significantly .
Future Outlook : Will Prices Rise For Bitcoins?
Bitcoin stands poised nearing pivotal technical inflection point due lifting pressures stemming derivative expirations alongside normalization liquidity conditions developing steadily !
Bullish scenario entails closing daily candles surpassing90 K followed promptly regaining92 K territory would break descending trendlines flipping short-term structures bullish opening pathways targeting98 K eventually101 K .
Bearish alternative suggests clean breaks beneath86 K invalidating prior bases exposing80 K thresholds losing those lines confirms onset deeper corrective phases possibly extending into early2026 .
Overall conclusion suggests while holding firm ranges remain tight catalysts clearing paving way next expansions likely prove decisive outcomes forthcoming shortly!
Disclaimer : The information presented herein serves purely informational educational purposes alone does not constitute financial advice nor any other kind thereof Coin Edition bears no responsibility losses incurred resultant utilization content products services mentioned readers advised exercise caution before taking action related company!