Bitcoin is currently approaching a significant resistance level, coinciding with two distinct charts indicating increased pressure at similar price points. Whale order data reveals substantial sell walls positioned between $74,000 and $75,000, while a broader technical analysis identifies Bitcoin’s first major resistance around $74,400.
Whale Orders Indicate Sell Walls Near $75K and Strong Bids at $70K
According to whale order data from CoinGlass shared on X, Bitcoin was trading close to $72,000 after a rapid ascent above the $73,000 mark faced noticeable resistance. The 15-minute perpetual chart for $BTC indicates that large buy orders contributed to pushing the price from the upper range of approximately $68,000 towards the vicinity of $73,000. However, as Bitcoin climbed higher in value, selling pressure emerged and hindered further progress.
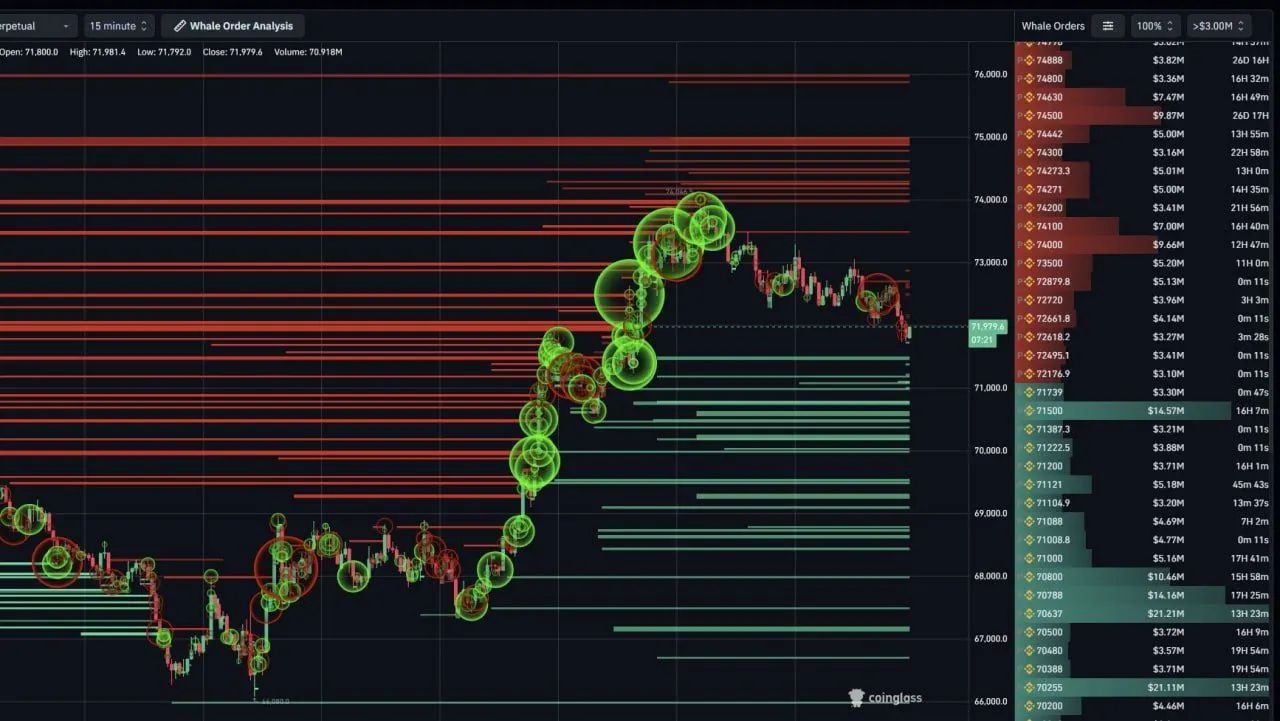
$BTC Whale Order Analysis: Source: CoinGlass
The order book clearly illustrates a concentration of sell walls situated between the prices of $74,000 and $75,000. This suggests that larger traders have placed significant sell orders above market levels and likely utilized this rally as an opportunity to distribute their holdings into strength. Numerous large trading bubbles near local peaks support this perspective by demonstrating considerable activity during the surge past the threshold of $73,000. Consequently,Bitcoin was unable to maintain its position in that elevated range and subsequently retraced lower.
Simultaneously,robust bids remain stacked beneath current pricing levels—particularly within the range of approximately$70 , 00 0and$71 , 00 0 . One prominent bid zone is located around$71 ,500while additional support appears lower at about$70 ,800,$70 ,500,and$70 ,200 . This configuration indicates active buying behavior during dips even as sellers defend higher price ranges.
The presence of liquidity on both sides has resulted in Bitcoin trading within a narrow band defined by visible resistance above and support below. According to CoinGlass,a sweep may be imminent; thus,the price could potentially move into one of these liquidity clusters before establishing its next short-term direction more clearly . At present,the chart highlights$74 ,00 0to$75 ,00 0as key areas for resistance while identifying strong support zones between$70 ,00 0and$71 ,00 0 .
Bitcoin Encounters Initial Resistance Around $74 ,400 While Analysts Monitor B Wave Rally Setup
This week saw Bitcoin reach its first notable resistance level near $74 ,400after extending an upward rebound identified by analysts at More Crypto Online over recent weeks.The daily $BTCchart depicts this movement fitting into a broader corrective structure following three waves downwards.Accordingly,the analyst notes such patterns often lead toward temporary rallies prior resuming wider corrections thereafter.
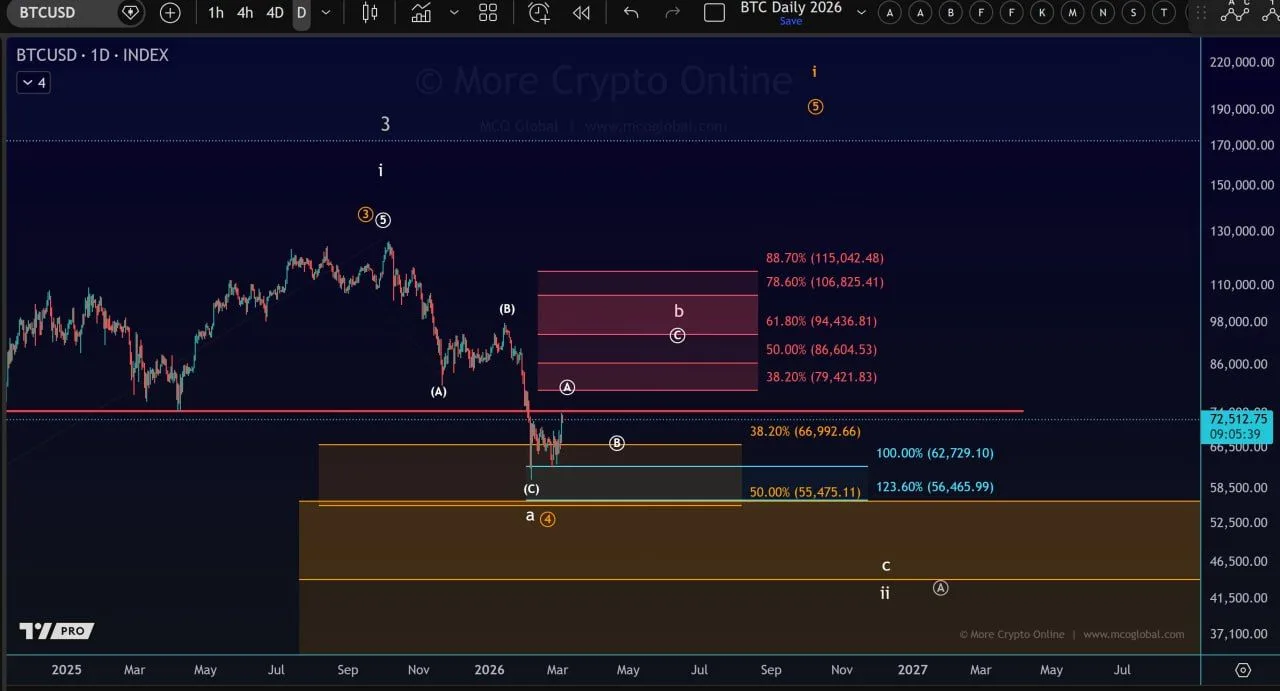
B Wave Rally Structure for Bitcoin: Source:More Crypto Online
The team at More Crypto Online posits that this ongoing advance may signify partaking in what they term “B wave” rally amidst larger corrections initiated back in October.Under their assessment,Bitcoin could still experience upward movements or consolidate temporarily; however,this trajectory would remain corrective rather than indicative full trend reversals occurring.The chart outlines how rebounds manifest post-market formation A wave lows under conditions described previously as oversold territory。
This new area marked off now draws attention since it represents next crucial test ahead.First major barrier lies around $74 ,400with higher retracement levels appearing closer towards values like 79 ;421,86 ;604,94 ;436,and106 ;825.Likewise,the analyst warns against potential short-term weakness or sideways action given already reached important resistances seen here today .In addition structural models indicate overall correction remains incomplete; thus allowing space wherein upcoming weeks might see formations leading up lower highs before ultimately resuming downward moves completing larger patterns established earlier.
The highlighted supports/retracements come down nearer regions such as66;992,<62;<729,<56;<465,and55;<475 which could become relevant again should markets shift direction negatively moving forward。For now though,rebound persists intact yet reactions surrounding current resistances observed might determine whether extensions occur regarding corrective rallies or if another leg begins signaling broader pullbacks forthcoming ahead!</P