The ongoing discussion surrounding Bitcoin’s price predictions is currently divided between two perspectives: accumulation and momentum indicators. Data from CryptoQuant reveals that the realized cap for new whales is on an upward trajectory heading into 2026, while a different weekly chart indicates that Bitcoin may dip to the low $82,000s, with its Relative Strength Index (RSI) entering a historically low range.
BTC Realized Cap for New Whales Surges Towards 2026
Recently established Bitcoin whale wallets have seen their realized cap increase significantly towards the end of the chart, approaching approximately $120 billion as BTC prices hover near their peak. The “BTC: Realized Cap for New Whales” graphic from CryptoQuant illustrates that this purple area was barely noticeable until 2021 but has been steadily growing through 2022 and 2023 before experiencing a notable rise in 2024.
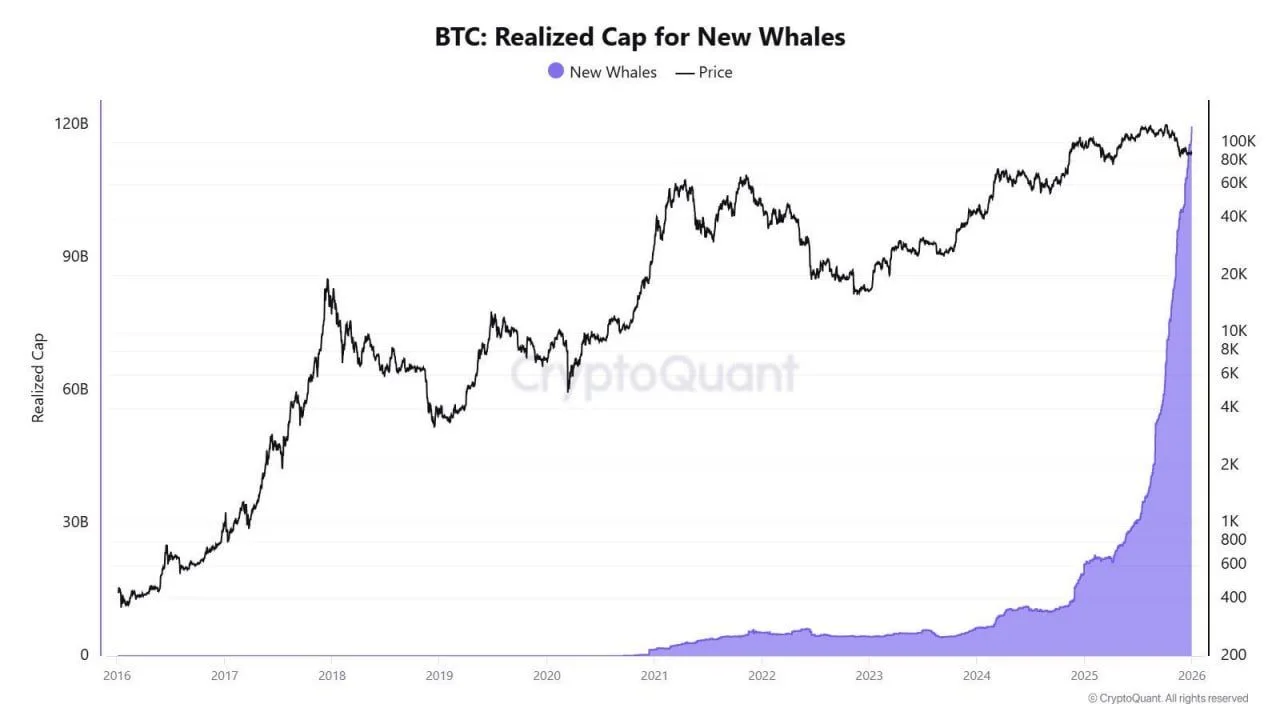
BTC Realized Cap for New Whales. Source: CryptoQuant/X
The curve then steepened dramatically. By 2025, the realized cap of new whales surged from a modest starting point to nearly vertical growth by year-end, aligning closely with the upper end of the left axis. Simultaneously, Bitcoin’s price line ascended into 2025 before stabilizing within an $80K to $100K range on the right axis; however, there was a slight decline at far right as this purple area continued its ascent.
A comparison with earlier cycles reveals distinct differences on this same chart. Prices soared in 2017 only to plummet through much of 2018 and rebound by early 2021 before another drop in late-2022 occurred. Notably, during those years prior to significant increases post-2019 onward—when new whale realized caps began building meaningfully—the scale did not reflect similar trends.
This analysis underscores an expanding disparity: newer large holders are rapidly increasing their aggregate cost basis while spot prices are advancing more gradually and consolidating around recent highs.
Bitcoin Weekly RSI Approaches Previous Cycle Lows as BTC Drops to $82,550 on Coinbase
In parallel developments, Bitcoin’s weekly RSI has fallen toward lower levels within its multi-year spectrum as BTC retreated back down towards approximately $82 ,550 according to TradingView data shared by Nexus on X . The provided screenshot displays last week’s candle opening near $94 ,182 , peaking around$95 ,950 , dipping close to$81 ,386before closing near$82 ,550—a weekly decrease of roughly12 .35 % .

Bitcoin U.S.Dollar1W CoinbaseRSI Chart.Source:NexusonX
Onthesamechart,Nexushighlightedearlierdownside pivotsincludingthe2018bear marketbottom,theCOVID era bottom,andthe“$18kwick”lowin222.Thepostaddedanewmarkernearthecurrentarea,labelingit“$82k25,”andarguedthatweeklyR SIhasreached oneofthelowestreadingsonrecord.
Inindicatorpane,theRSIlineispositionednearband’slowerboundaryandalignswithseveralcircledtroughsthatappear duringprior drawdowns.Thos eearlierRSIdipspreceded reboundsinpriceonthedisplayedhistoryalthoughchartitselfdoesnotquantifyreturnsortiming.Asresult,imageframescurrentmoveasadeepmomentumresetoccurringafterBitcoin’srun towardthe$120000areashownneartopcycle.