The price of Bitcoin is set for a potential 5% rebound as it approaches the resistance trendline within its channel pattern.
Recent data from Farside investors reveals that U.S.-based spot $BTC ETFs saw an impressive inflow of $199.4 million on Monday.
The current crypto fear and greed index, sitting at 28%, reflects a prevailing bearish sentiment in the broader market.
On Monday, Bitcoin experienced a notable increase of 2.4%, trading at $75,835. This surge was prompted by comments from U.S. President Donald Trump expressing his desire to negotiate an end to ongoing conflicts. The cryptocurrency gained additional momentum due to renewed investments in its U.S.-based $BTC ETFs and positive on-chain data indicating confidence among long-term holders. Is Bitcoin ready to reclaim the significant $80,000 threshold?
A Historic Low in Coin Days Destroyed Indicates Strong Holding Behavior
The Coin Days Destroyed metric for Bitcoin has reached its lowest level since 2022, according to data released by Alphractal on March 16th, 2026. This indicator appears as orange bars on multi-year charts and is nearing the bottom range while overlaying with Bitcoin’s price line around $100,000.
This ratio assesses daily coin days destroyed against a long-term average to evaluate activities related to Bitcoins accumulated over several years. Current readings show extremely low destruction levels of these accumulated days; hence units purchased during previous cycles are showing minimal transfers across the blockchain.
This situation indicates that transaction volumes are primarily driven by recently acquired Bitcoins rather than older holdings collected over time. In earlier high-price phases, many long-term owners shifted their positions which resulted in fresher supply dominating daily transactions.
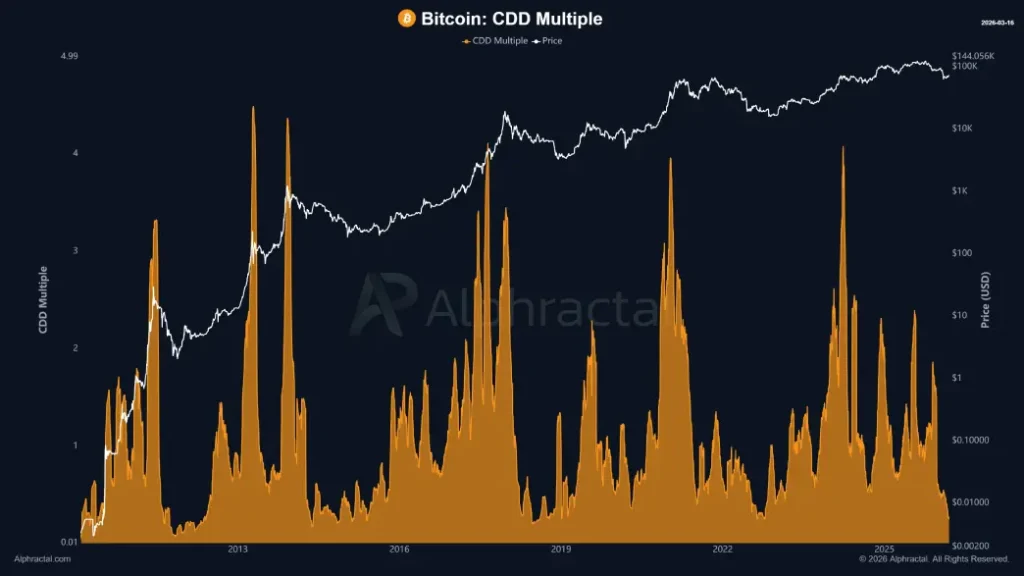
The Alphractal visualization spans more than ten years and highlights recurring spikes in this metric during previous valuation surges around 2013, 2017, and 2021. The latest decline coincides with price stabilization at elevated levels through early 2026.
Channel Pattern Influences Mid-Term Downtrend for Bitcoin Price
<pDuring an eight-day rally, Bitcoin's value rose significantly from $65,844 to its current trading figure of $74,578—a remarkable gain of approximately 13.78%. This bullish movement broke through immediate resistance at $73,901 after five weeks of consolidation among buyers.
This sideways action amid geopolitical tensions provided an accumulation zone for $BTC, rejuvenating bullish momentum supported by a Relative Strength Index (RSI) reading of about 60% backing this recovery narrative.
The post-breakout rally could see prices climb another estimated **5 .5 %** before facing critical resistance along the descending channel pattern trendline situated at **$78 ,385** .
Since October **2025**, bitcoin has followed a consistent correction trend within two parallel lines defining this pattern . A potential retest against this upper boundary serves as crucial support for $ BTC .
Thus , breaking through this resistance could amplify bullish momentum leading towards prolonged recovery efforts aimed at reaching **$100k** .

$ BTC / USDT -1 d Chart
Conversely , should bitcoin’s value retreat from upper boundaries signaling bearish reversals , sellers may push prices down further toward hitting thresholds near **$50 ,000** mark .