As of 8:45 a.m. Eastern Time, Bitcoin was trading at approximately $113,366 per coin, supported by a market cap of $2.25 trillion and a 24-hour trading volume reaching $44.94 billion. The price fluctuated between $110,822 and $113,484 throughout the day, indicating a period of steady consolidation within an overarching bullish trend.
Bitcoin Analysis
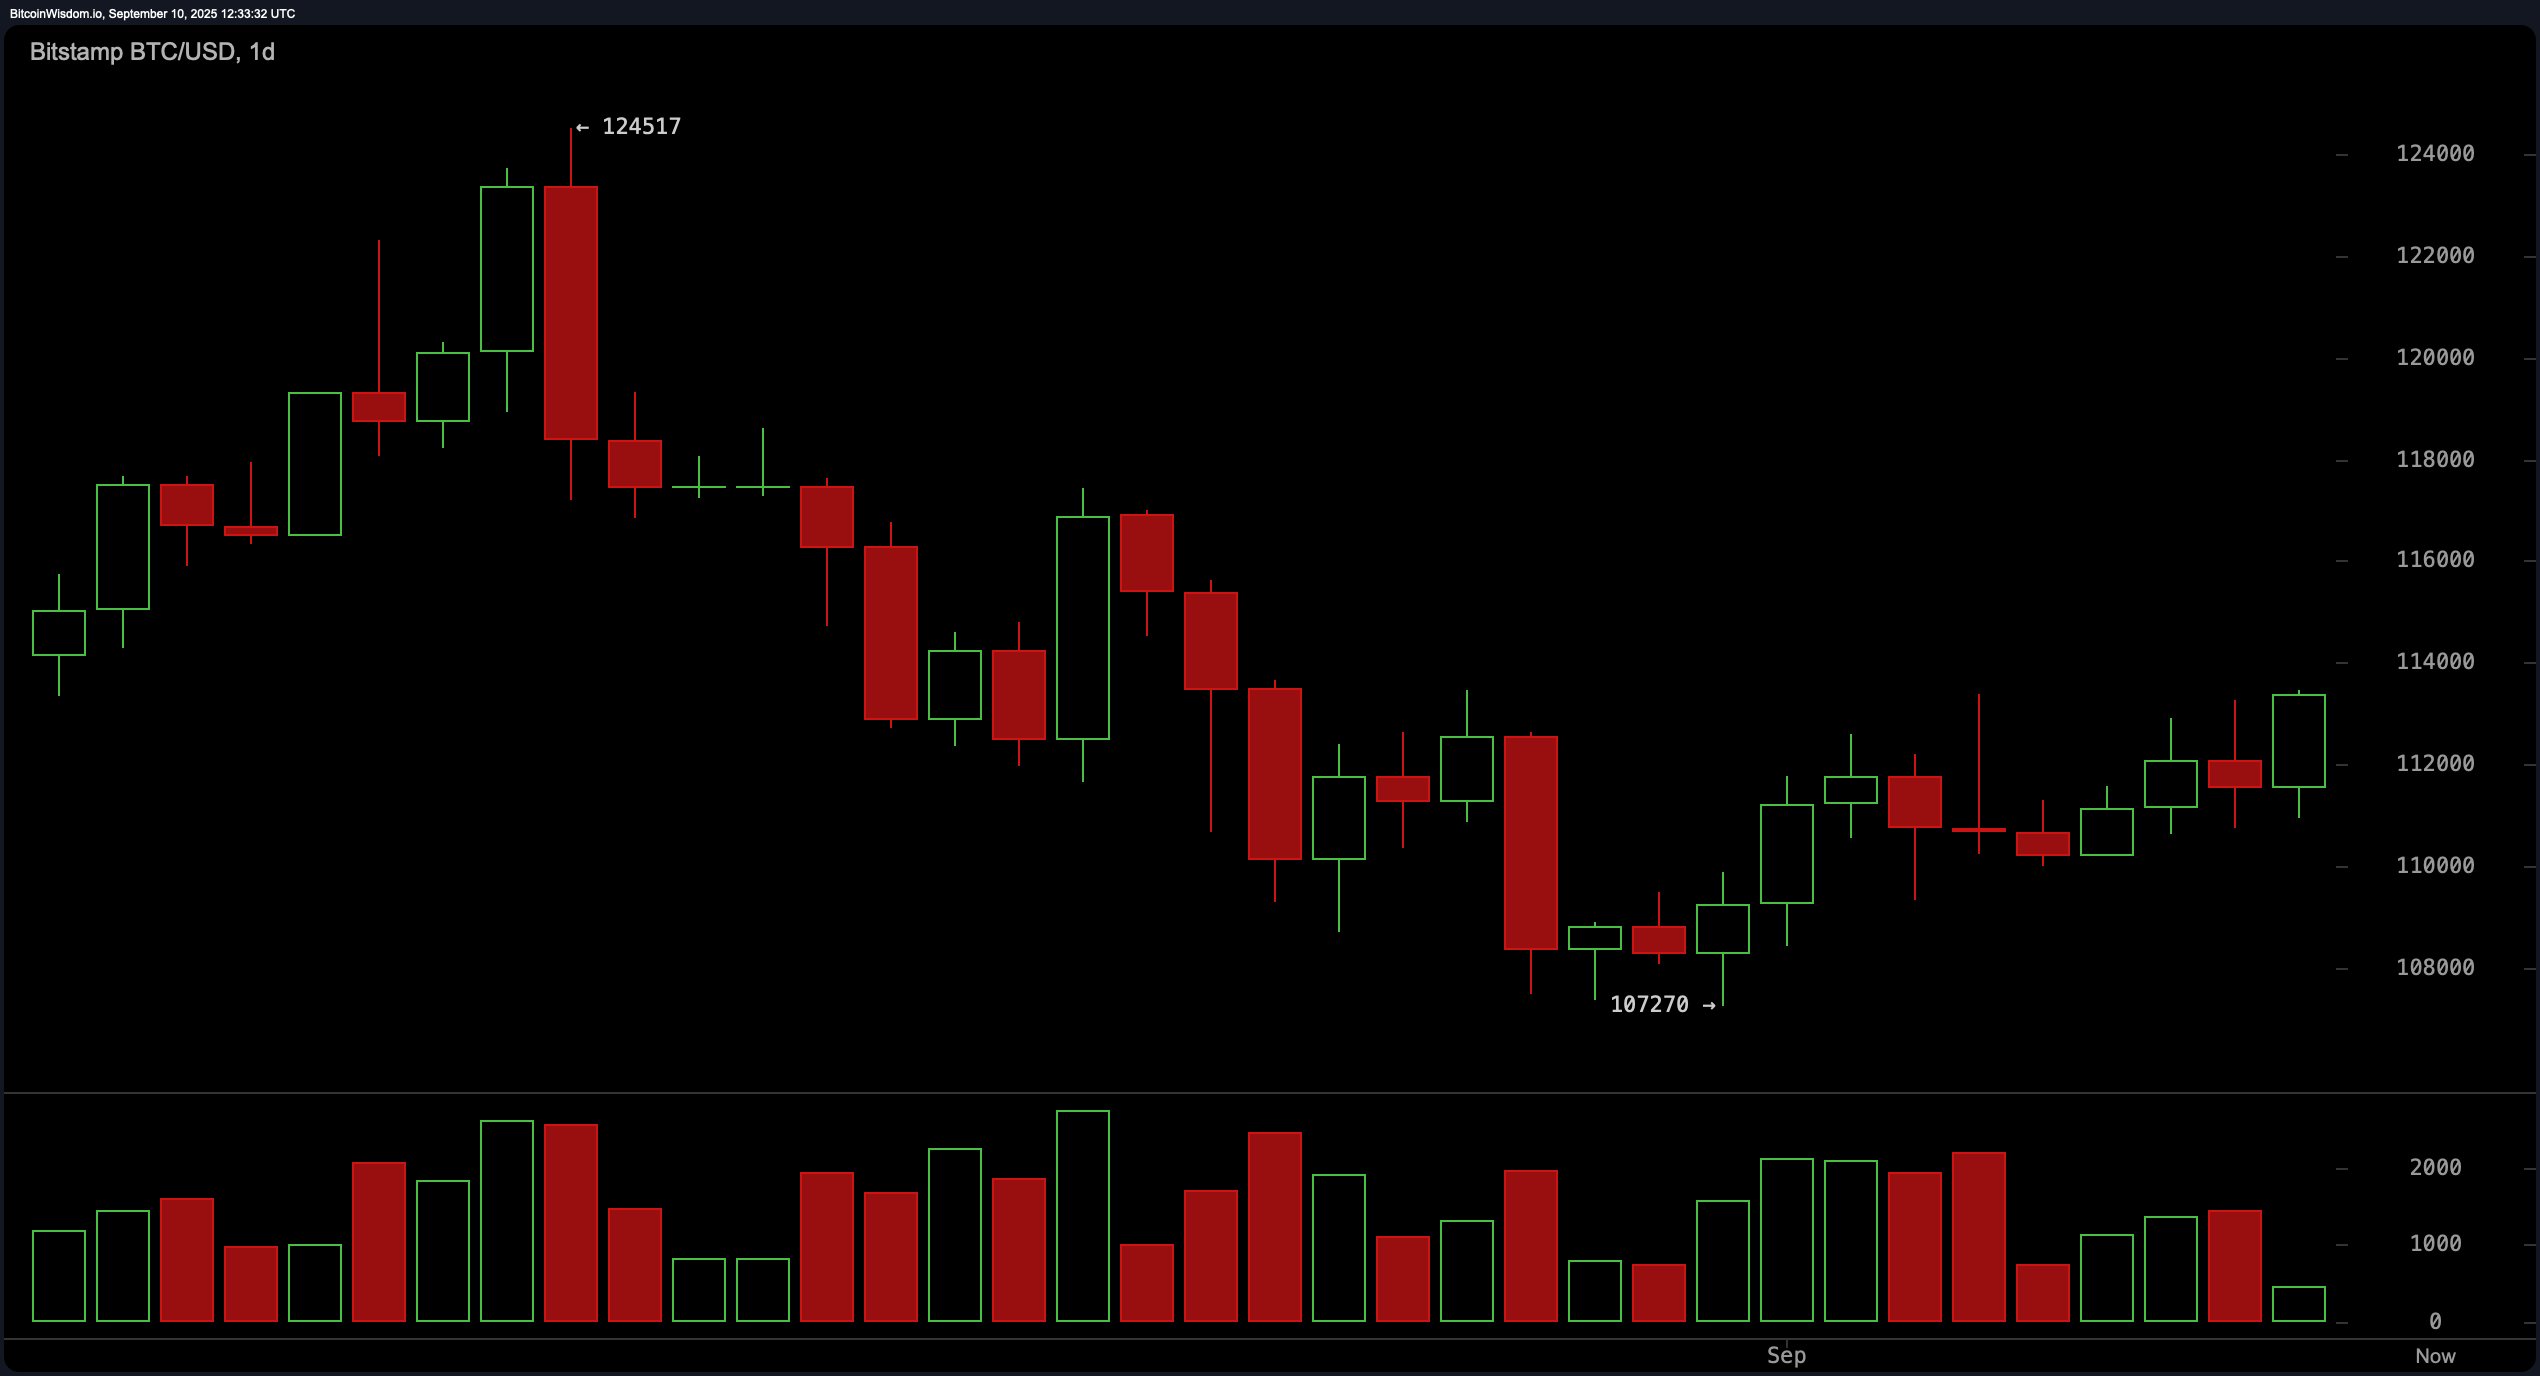
The short-term outlook for Bitcoin appears cautiously optimistic as it begins to recover from its recent downturn. An examination of the daily chart reveals that prices have dropped from around $124,517 to a local low near $107,270 before experiencing a modest upward correction. The presence of both falling wedge patterns and bullish engulfing candles near this low suggests that there may be structural support for this rebound. Significant resistance is identified in the range between $113,500 and $114,000 while immediate support can be found close to the level of $107,000. A pullback into the zone between $110,000 and $111,000 could present an opportune entry point—especially if accompanied by decreasing volume—which might indicate preparation for another attempt at higher resistance levels.
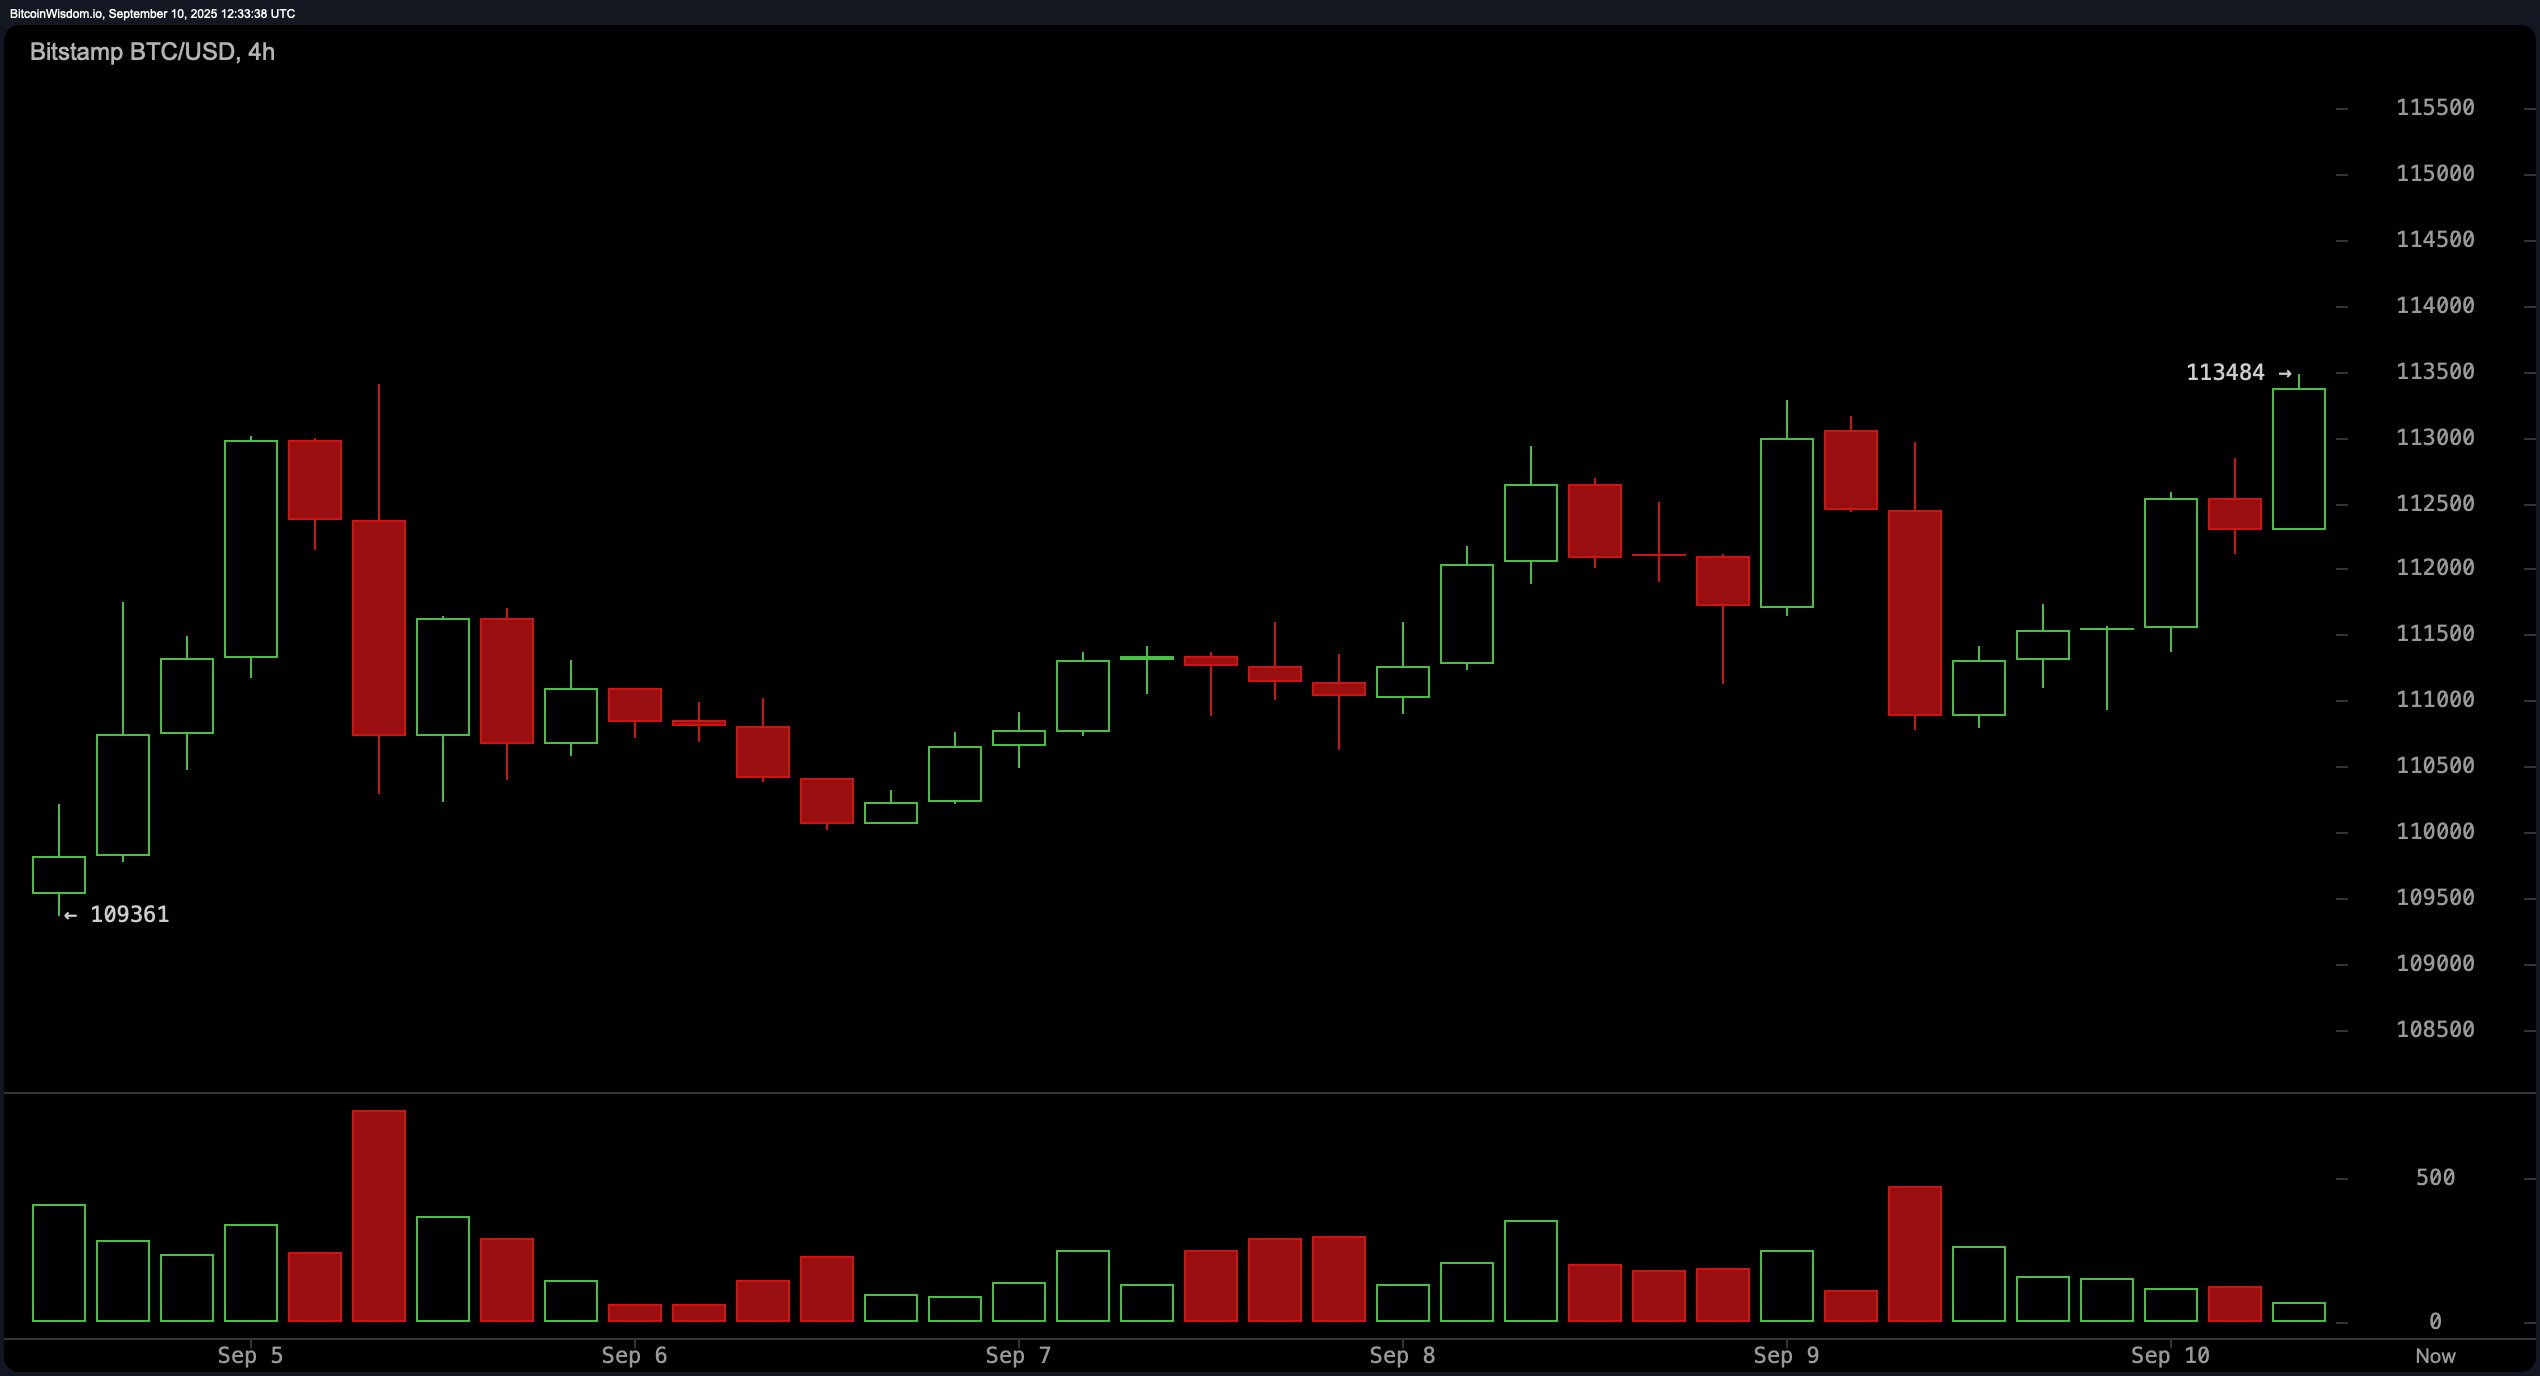
The 4-hour chart illustrates signs of stabilization and accumulation in Bitcoin’s price action. A double bottom formation around the levels of approximately $109,500 and $110,000 establishes a technical foundation followed by a clear breakout through previous descending structures in pricing trends. Volume analysis indicates that these bullish movements are supported by robust demand which enhances confidence in this breakout’s legitimacy; currently positioning itself favorably within an entry zone ranging from about$111 ,800 to$112 ,200 . Nevertheless ,the critical resistance levels remain at$113 ,500–$114 ,000 unless we see significant increases in volume confirming further upward movement.
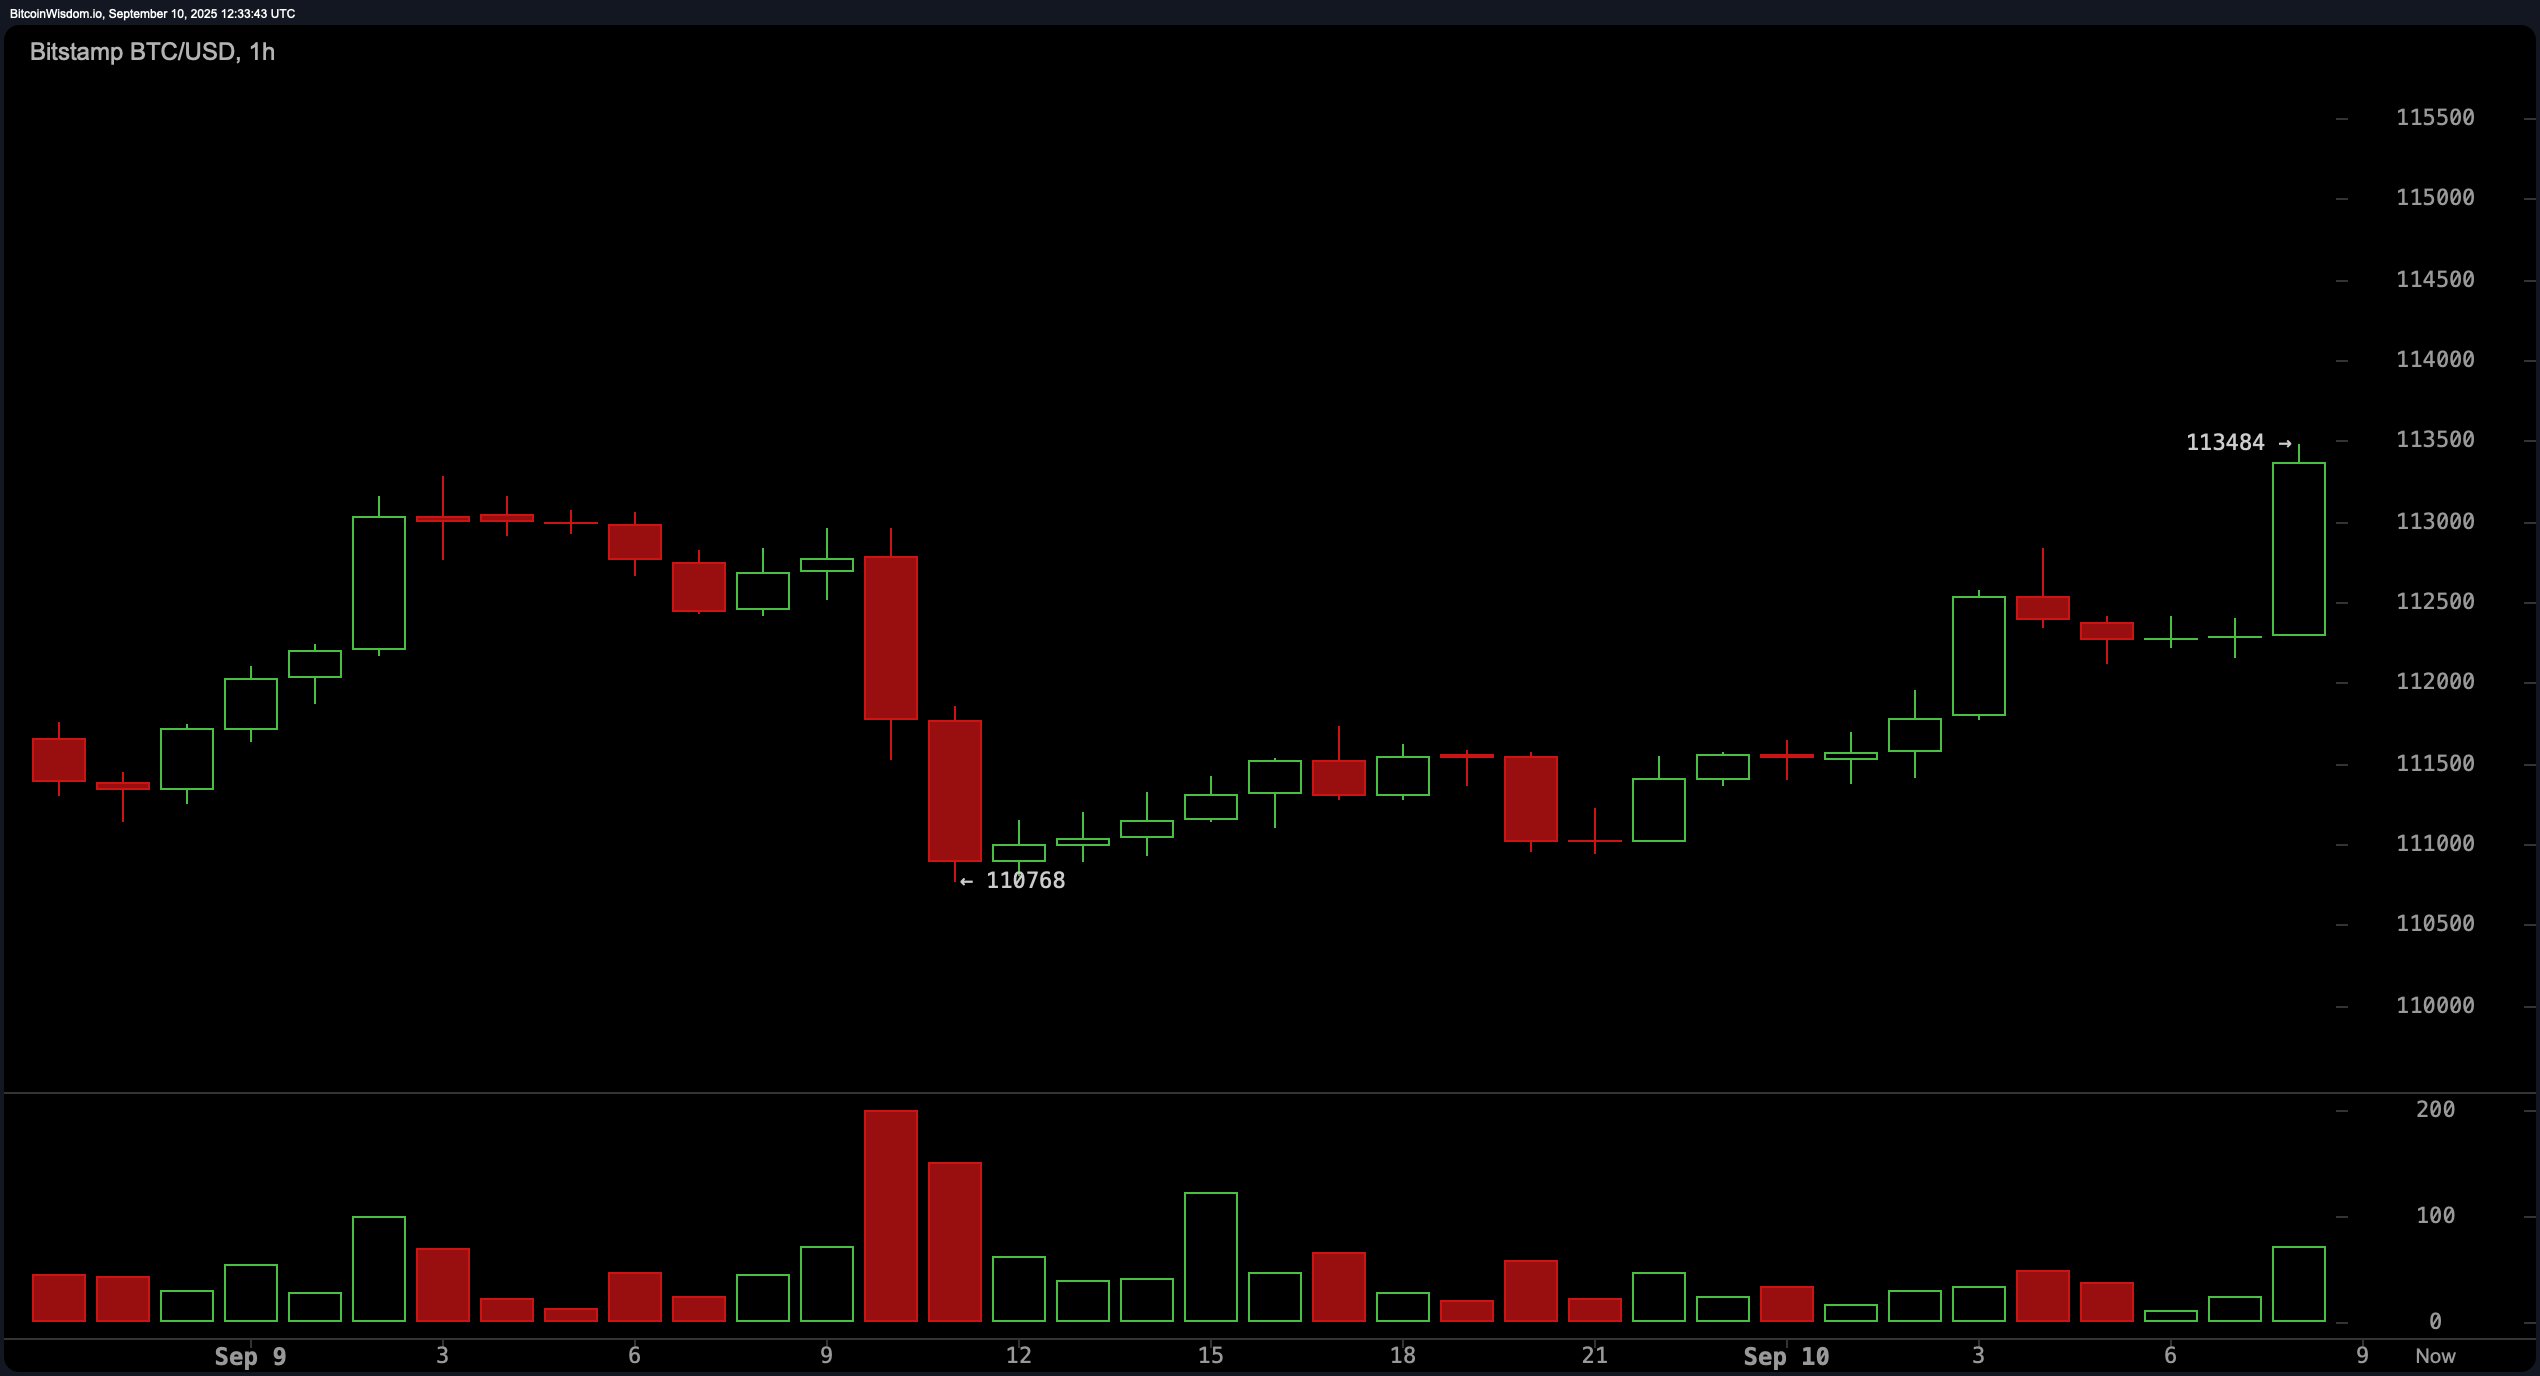
On the hourly chart for Bitcoin shows it is currently undergoing consolidation after experiencing minor gains recently . Following an increase from lows around$110 ,768,Bitcoin decisively surpassed$112 ,000,resulting in formation indicative higher low structure—a common precursor continuation patterns . Price activity has since stabilized around roughly$$1125o0 with diminishing volumes suggesting traders are waiting on catalysts . Breakout traders may find opportunities above$$112600 provided there’s accompanying surge volumes while more conservative approaches could focus on accumulating positions nearer$$111800 with tight risk management strategies implemented . Profit-taking considerations should arise near $$113700 up towards $$11400 where selling pressure previously emerged.
From an analytical perspective using indicators reveals oscillators largely neutral; relative strength index (RSI) stands firm at50 whilst stochastic oscillator reads76,and commodity channel index (CCI) records35—all signaling indecision among market participants.The average directional index(ADX)is noted at14 affirming absence strong trends however momentum oscillator registers4128 alongside moving average convergence divergence(MACD)at−879 both hinting potential upside momentum brewing beneath surface conditions
A review moving averages depicts transition phase ongoing across markets.Short-term averages such as10-day exponential moving average(EMA)at111384 alongside20-day EMA registered111890 lend supportive signals towards bullish actions although intermediate-term metrics like30-and50-day MA show bearish tendencies implying overhead resistances persist.Longer-range indicators including100-and200-day simple/exponential MAs highlight broader recovery efforts taking place reinforcing prevailing positive sentiment overall
As bitcoin continues consolidating below significant resistances watching closely how volumes react will determine whether markets break upwards or face rejections.Traders advised monitor closely region between$$113500–$$11400 if bitcoin fails convincingly breach these areas reversals likely ensue conversely confirmed breakouts above pave pathways retesting prior highs exceeding $$114500 potentially even reaching beyond.$$11500 reigniting renewed optimism surrounding asset class
Bullish Outlook:
The current phase sees bitcoin firmly positioned within its recovery trajectory following recent lows bolstered favorable short- & long-term averaging patterns constructive charts indicating positive momentum indicators supporting assertions made thus far.If validated through increased volumes breaking past thresholds established earlier ($13k-$13k), paths toward revisiting levels approaching($14k+) remain viable options ahead!
Bearish Outlook:
Despite signs showing some progress achieved thus far key barriers still exist preventing meaningful advances occurring nearby ranges ($13k-$14K).Oscillators maintain neutrality mid-range metrics continue signal sell pressures looming over heads should failure manifest itself breaking higher risks emerge exposing downside retracements targeting zones ($11K-$10K).