On September 11, 2025, Bitcoin was valued at $114,011, backed by a market capitalization of $2.27 trillion and a trading volume of $48.11 billion over the past 24 hours. The intraday price fluctuated between $112,255 and $114,451, indicating a tight consolidation phase within an important resistance area.
Bitcoin
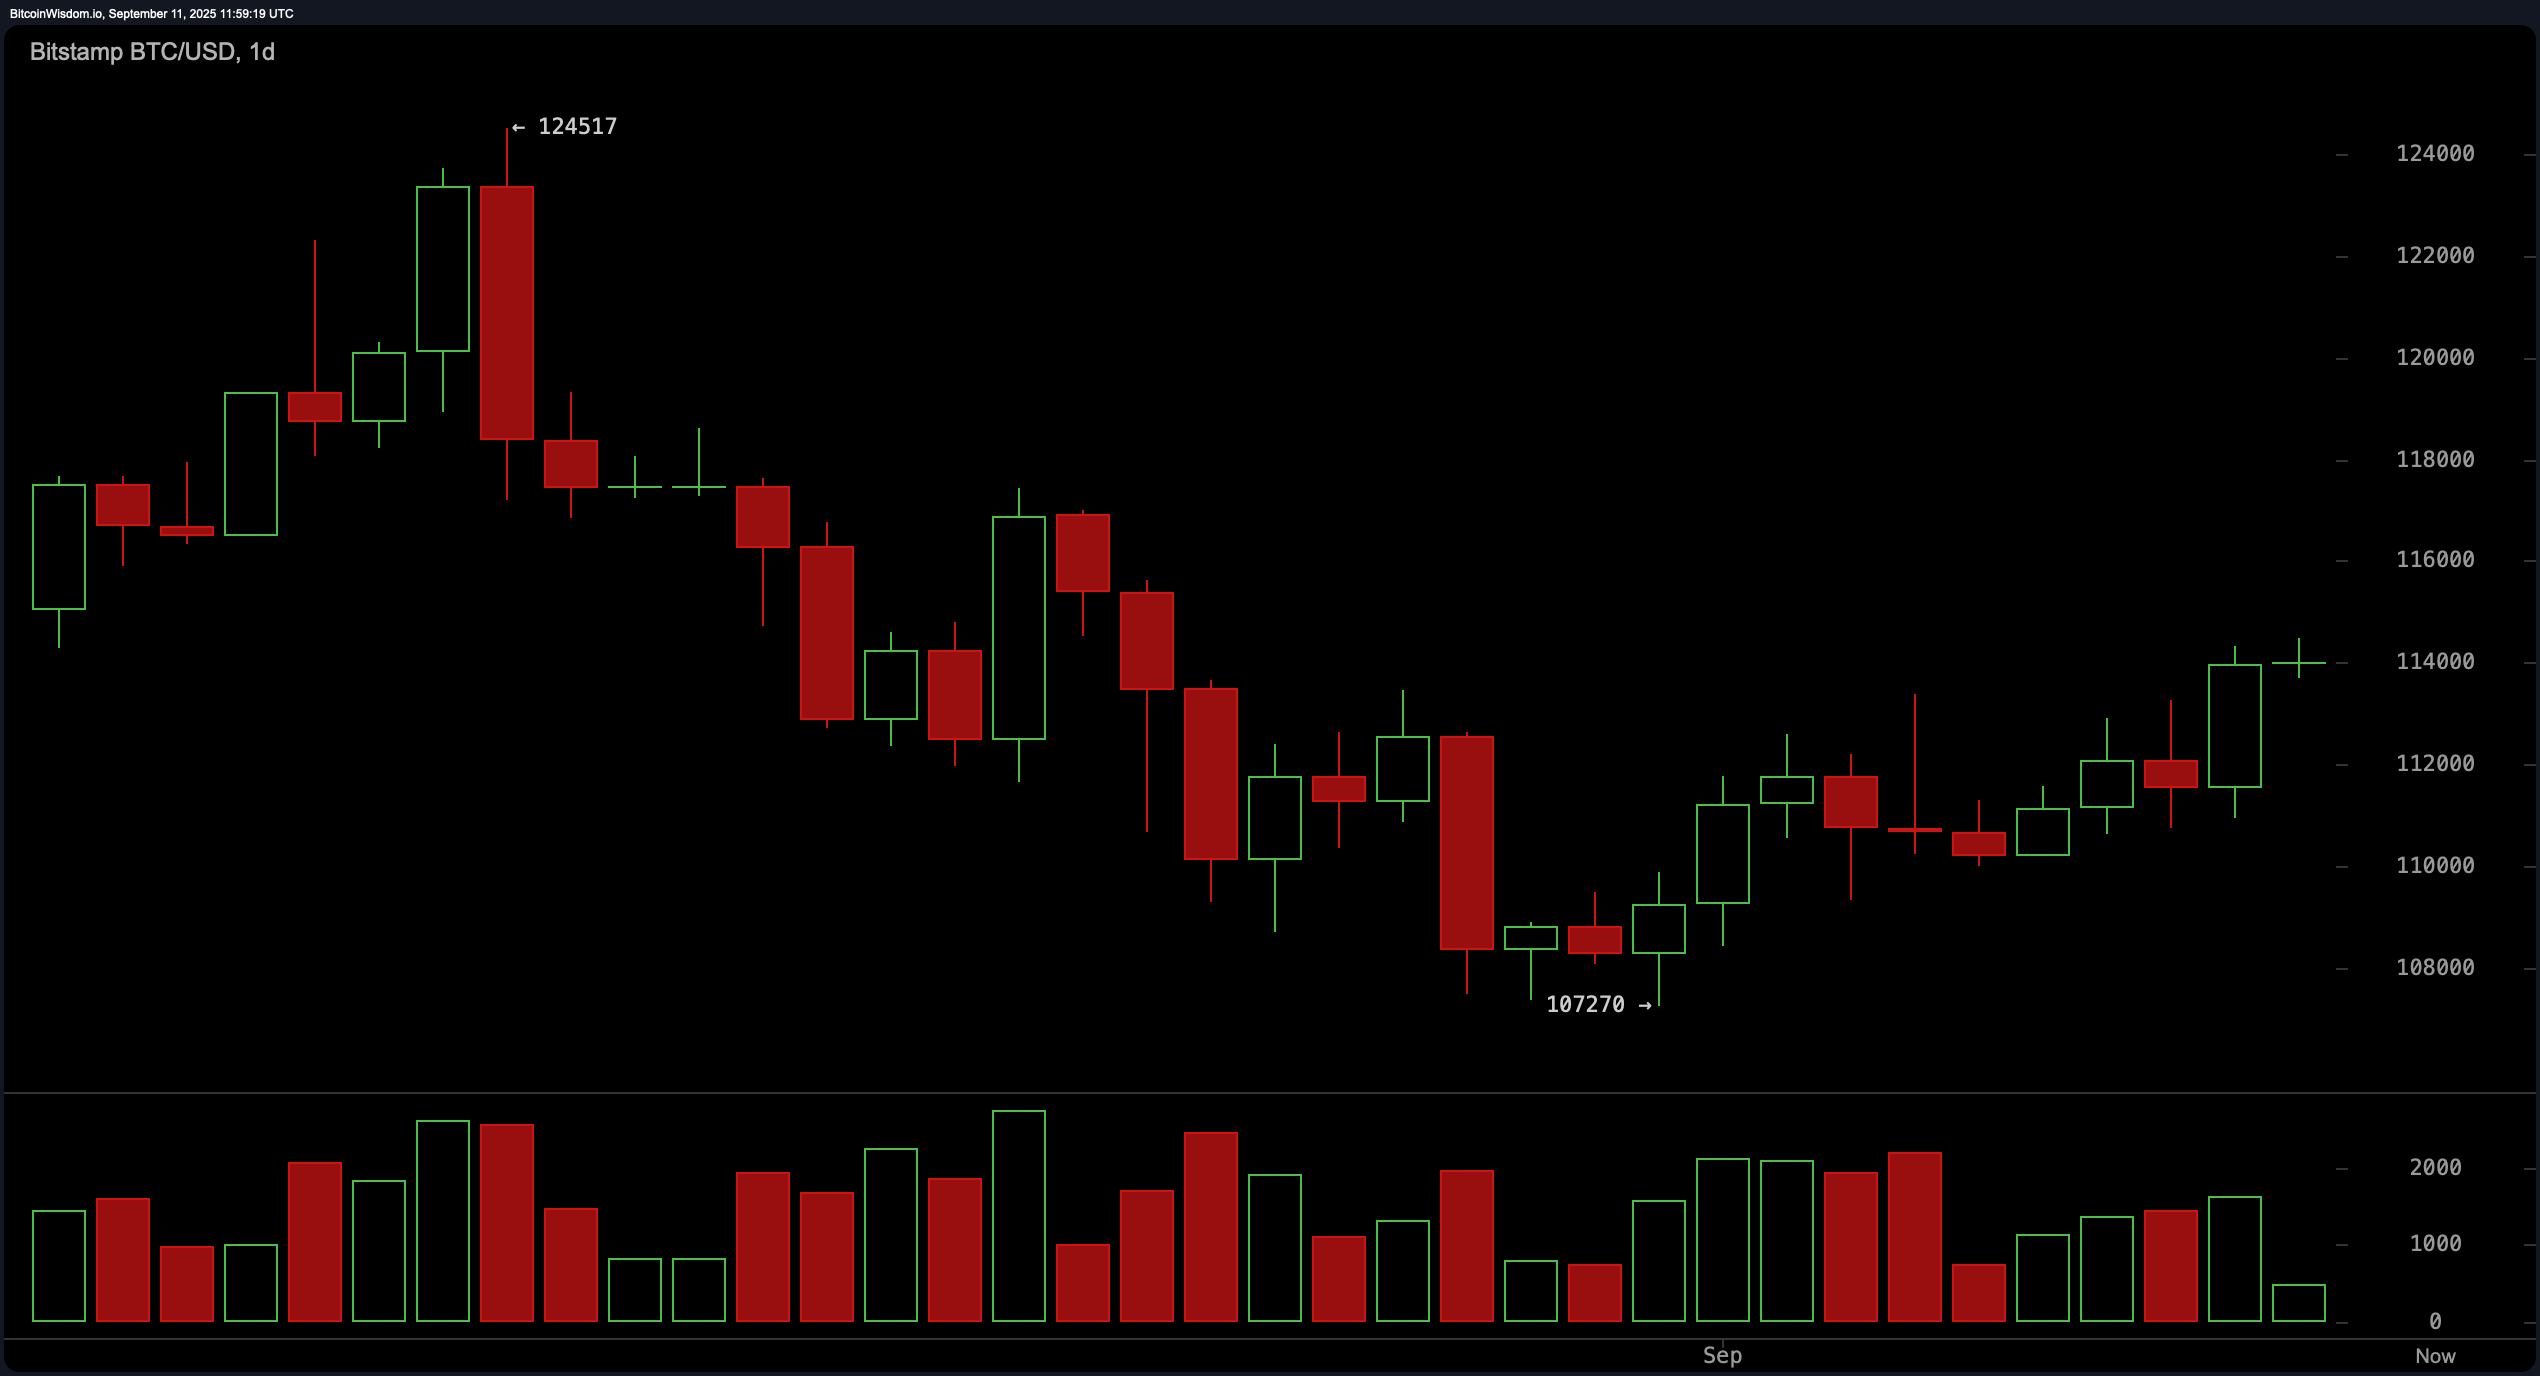
The daily chart for Bitcoin illustrates a steady recovery from an earlier downtrend that saw prices fall to around $107,270. The recent formation of higher lows and higher highs suggests a potential bullish reversal is underway; this is further supported by increased volume on upward candles—indicating early accumulation efforts. The zone just above the $114,000 mark serves as a critical pivot point; closing above this threshold with substantial volume would confirm the breakout into bullish territory.
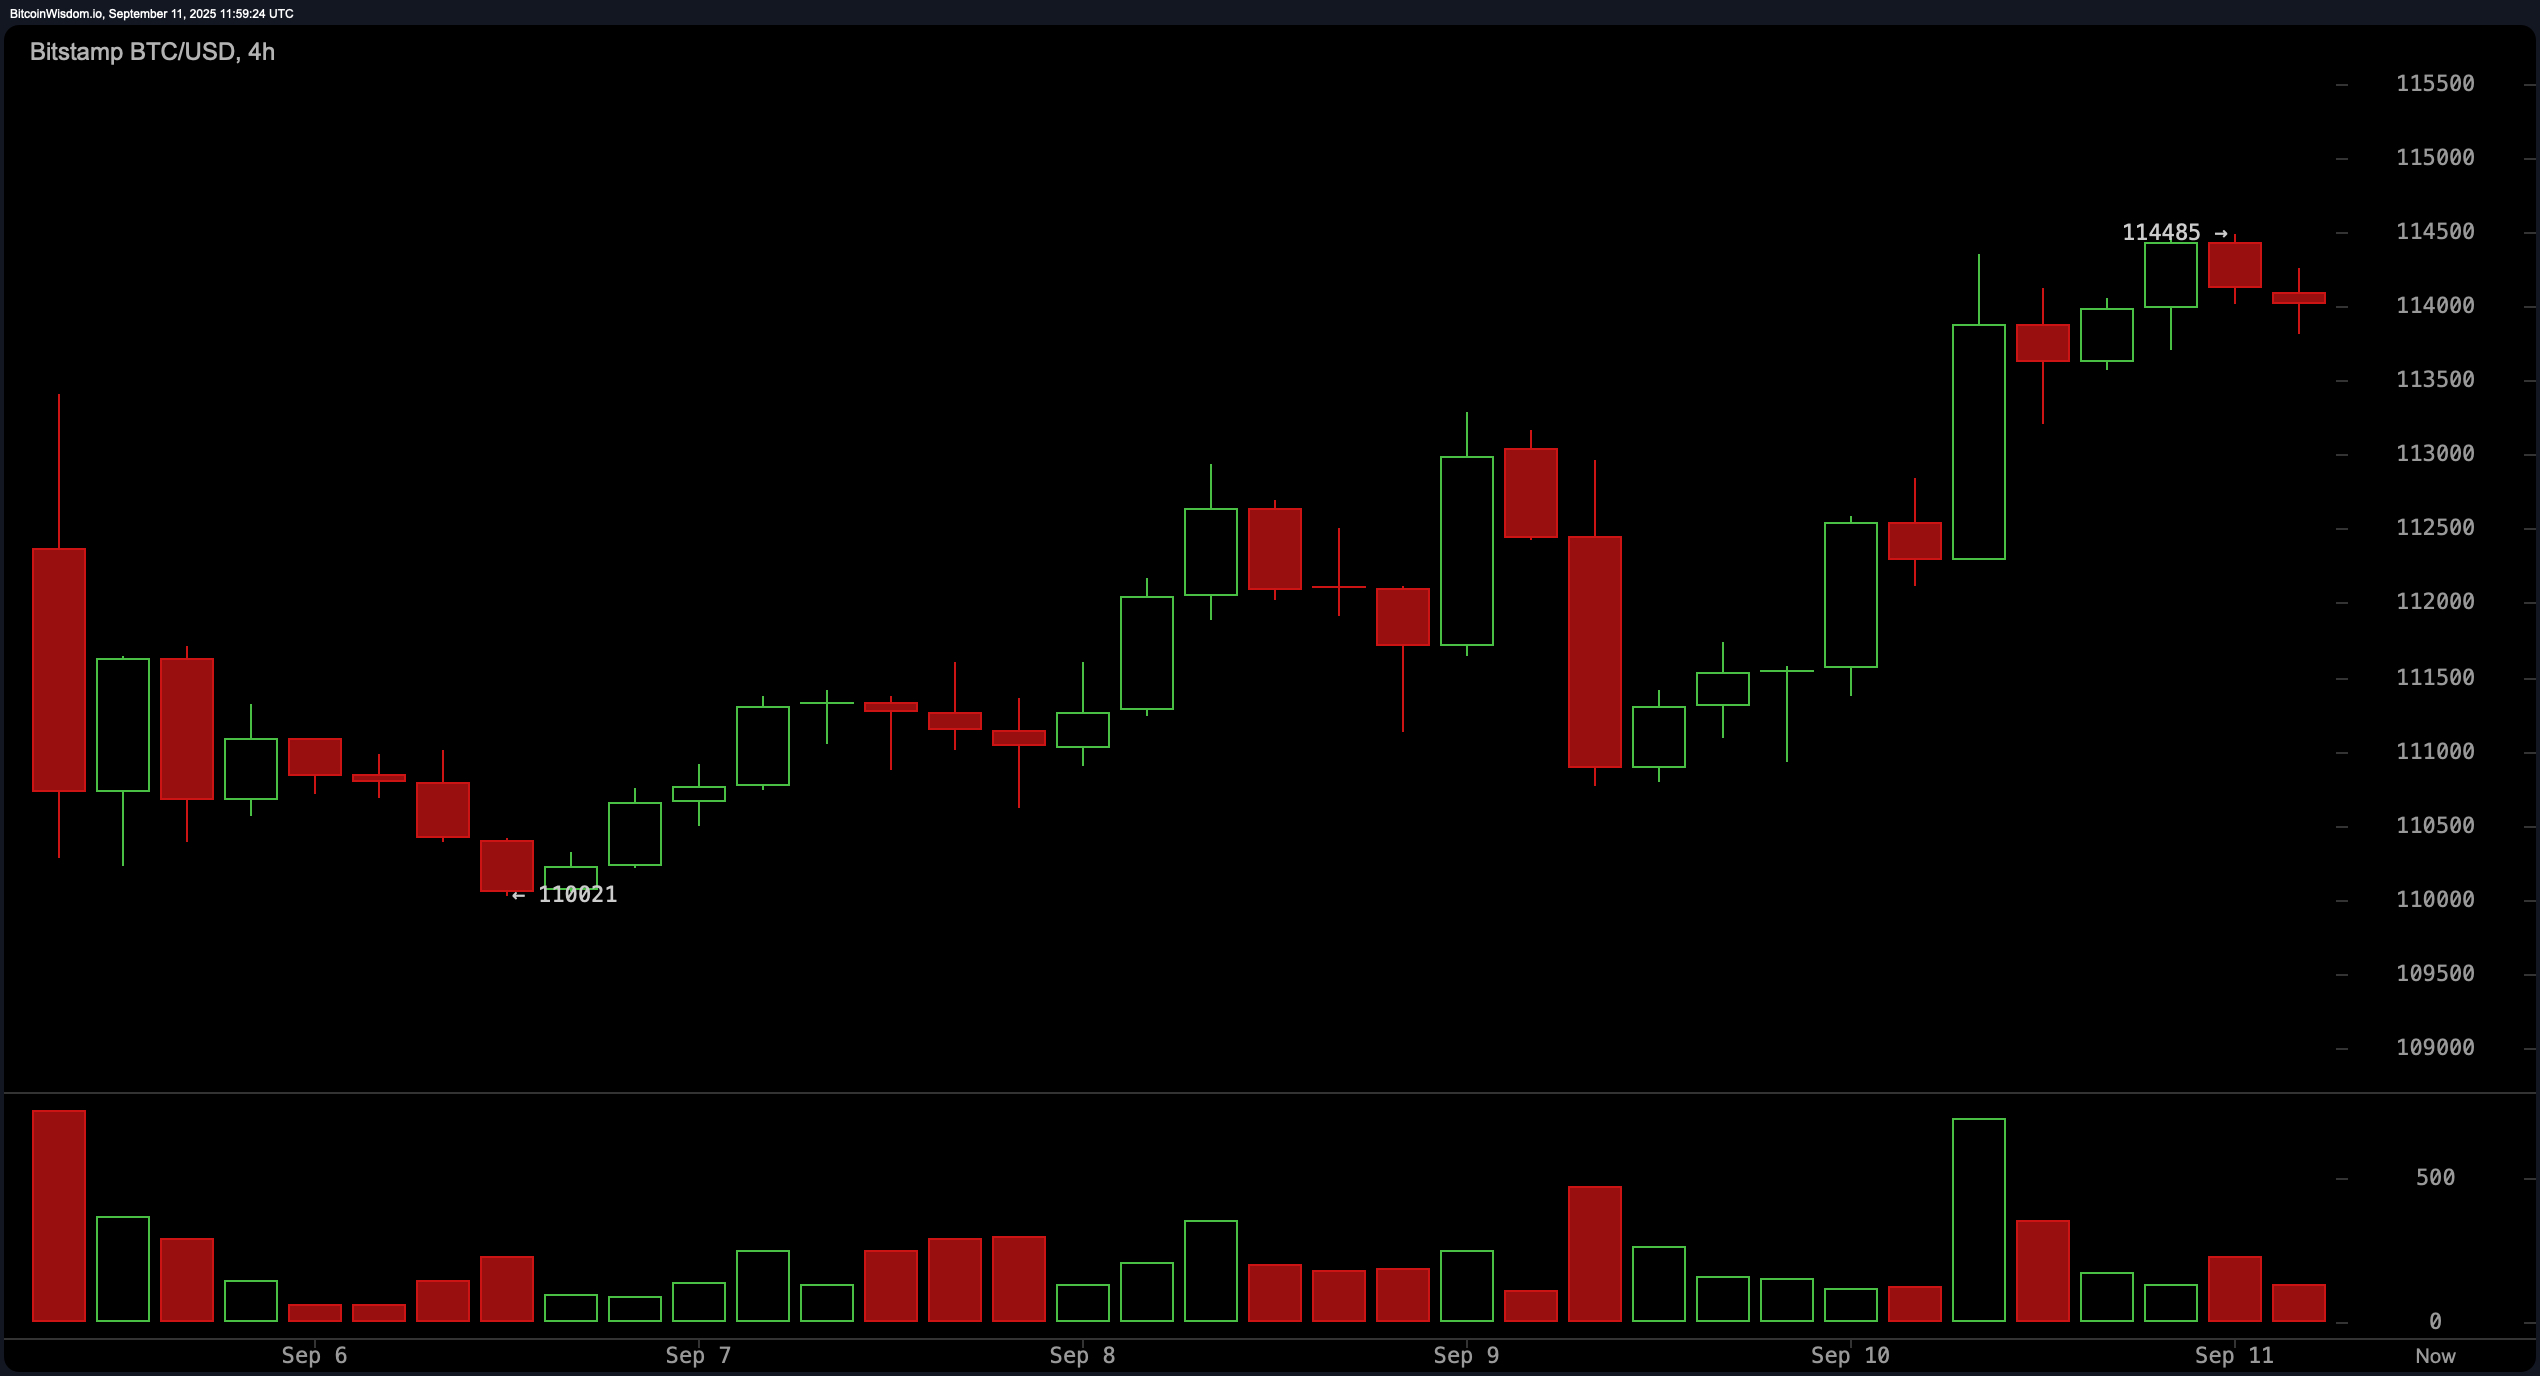
According to the 4-hour chart analysis, Bitcoin has risen from approximately $110,021 to reach as high as $114,485 due to consistent bullish momentum observed in recent days. This upward movement has now entered what seems like a consolidation phase near resistance levels. A range between $112,500 and $113,000 could provide short-term entry opportunities if it solidifies as support. Conversely, breaking through the resistance at around $114,500 with heightened trading volume would pave the way for further gains; however falling back below the key level of $110K would invalidate this current bullish trend and raise concerns about deeper pullbacks.
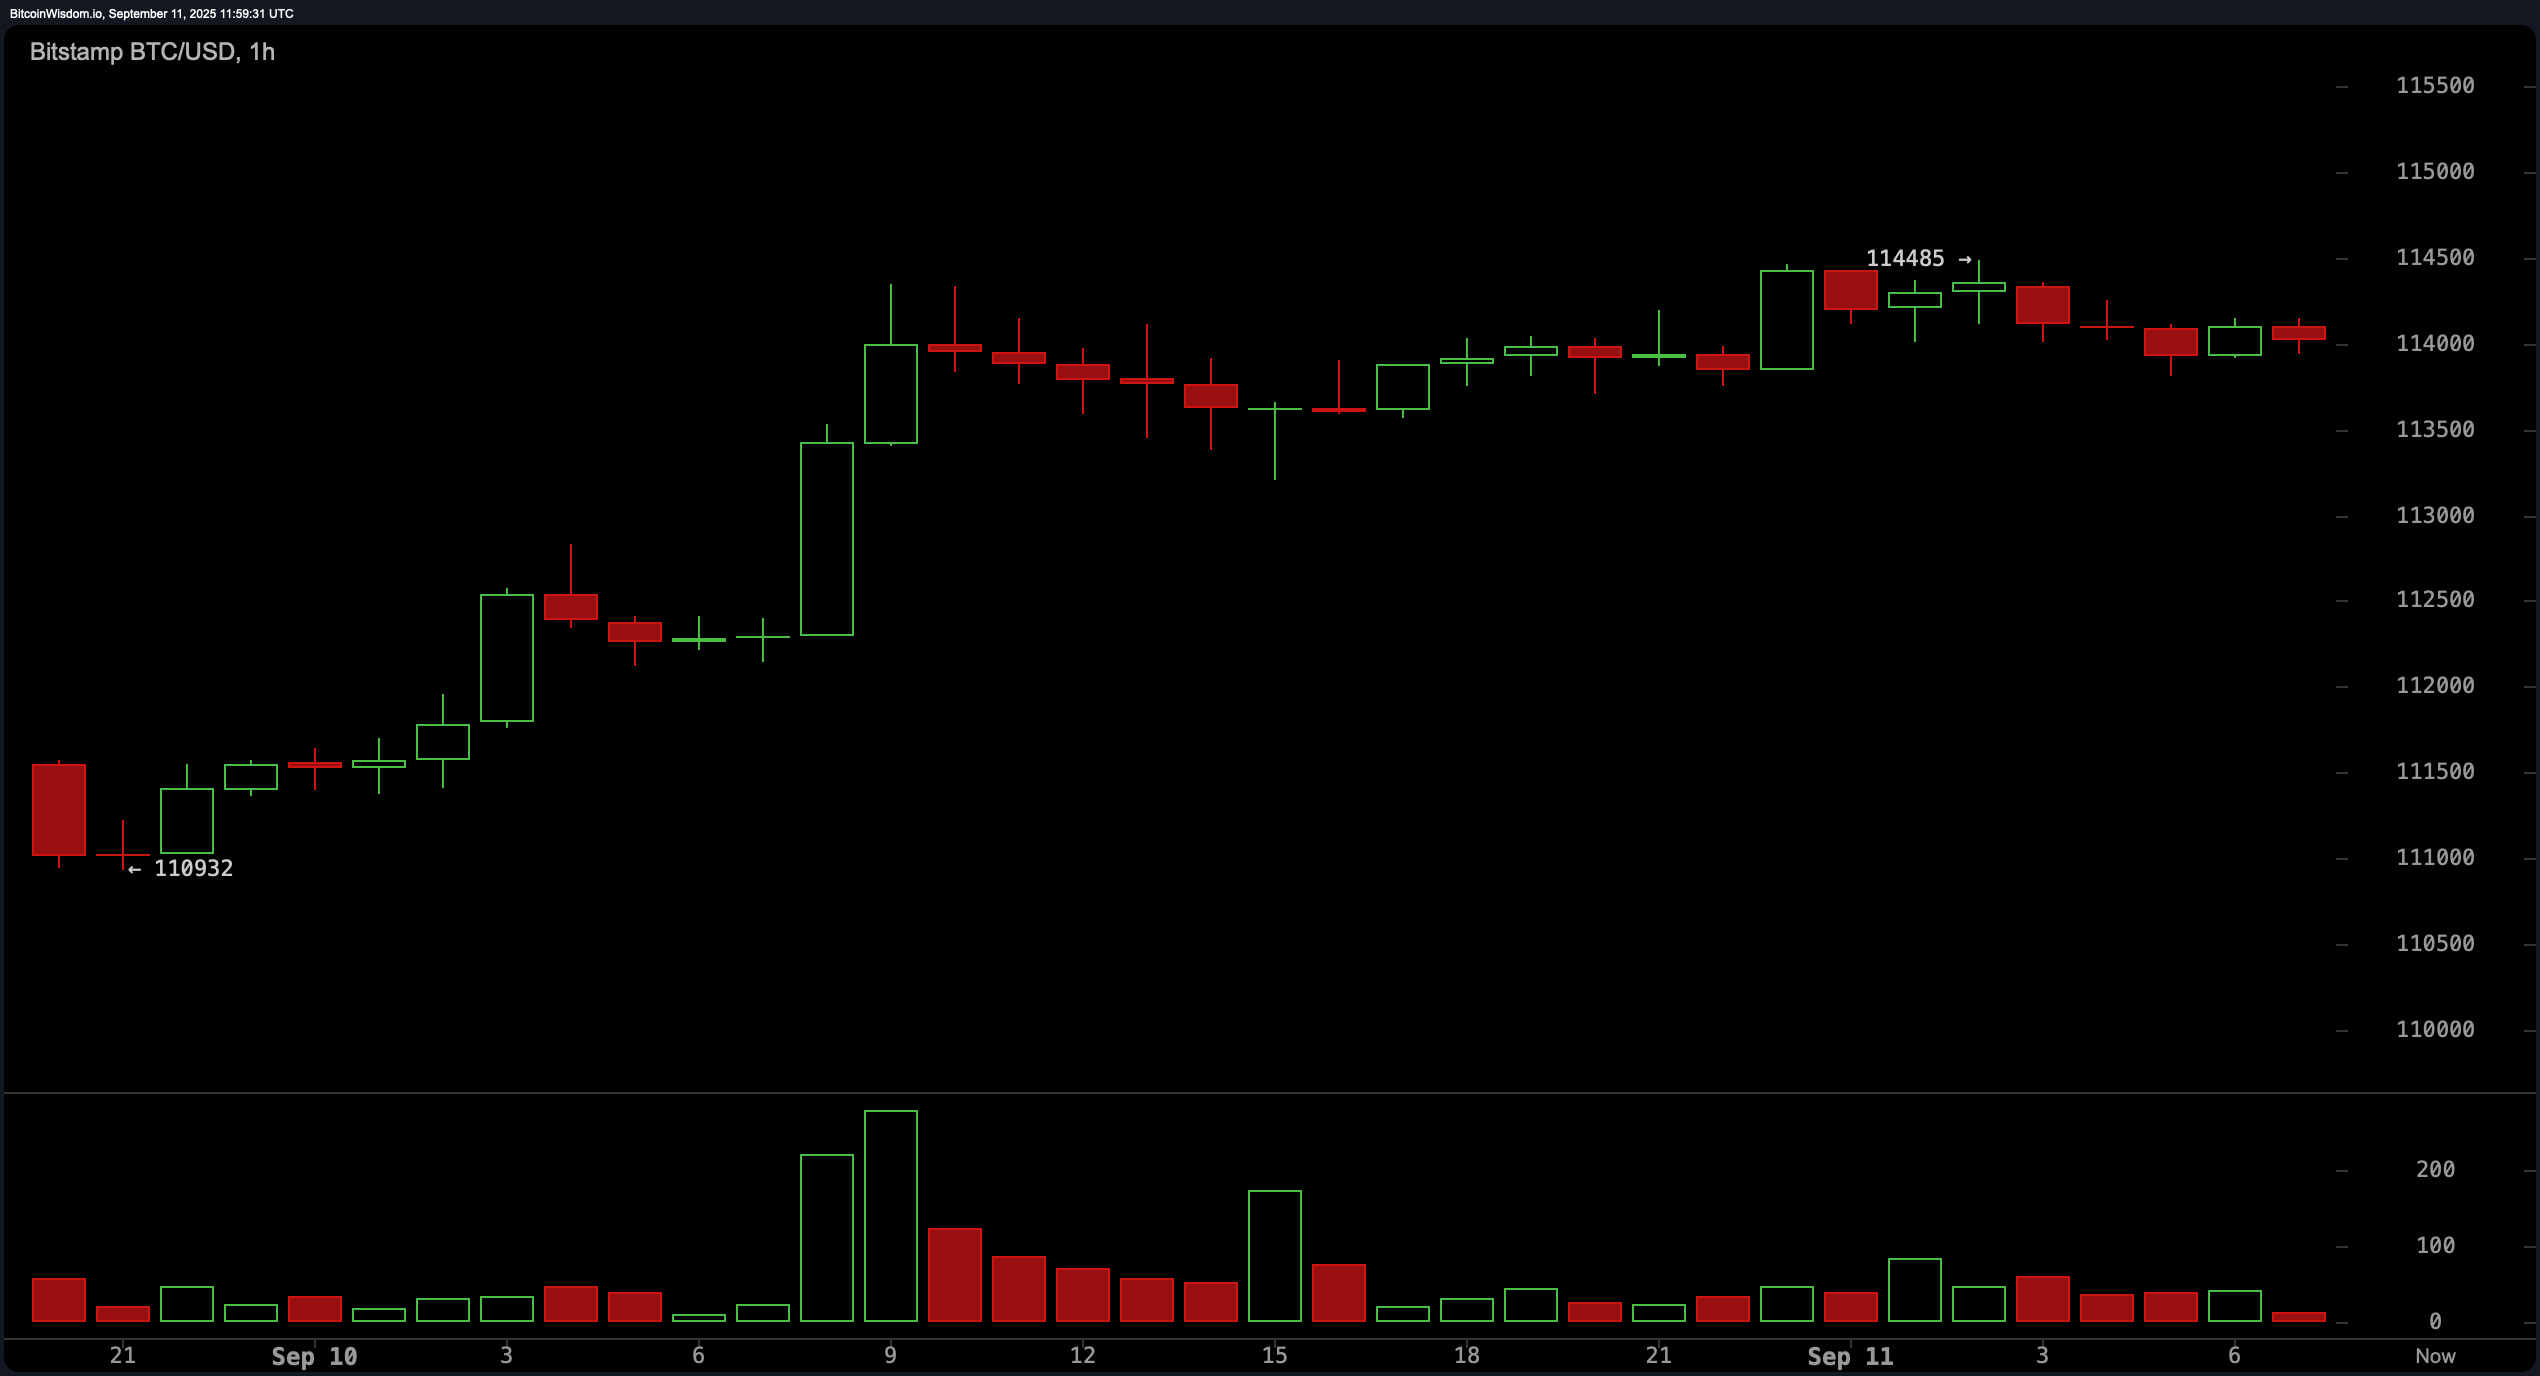
The hourly timeframe shows that Bitcoin’s price structure is tightly knit following an impulsive move from roughly $$110932$$ up to $$114485$$. Current price movements indicate either a bull flag or pennant pattern—often seen in trending markets as continuation signals. While low trading volumes suggest indecision among traders currently positioned in these ranges may find opportunities should there be breakouts beyond $$114500$$ targeting zones between $$115000$$ and $$115500$$; however drops below $$113000$$ could hint at short-term weakness along with potential bearish shifts in momentum.
Technical indicators present mixed signals but lean slightly towards bullish sentiment overall: oscillators such as relative strength index (RSI) sit at 54 while stochastic measures reach up towards 86 alongside commodity channel index (CCI) measuring out at 137—all suggesting neutrality overall across various metrics including average directional index (ADX) which rests comfortably around fifteen points reflecting stability amongst trends moving forward! However caution must still be exercised given awesome oscillator displaying slight bearish tendencies (-1514), whereas momentum indicator registers lower sell bias (+4772). In terms of trend-following indicators nearly all significant moving averages align positively showcasing sustained upward pressure except notably for fifty-period simple moving average remaining firmly entrenched within negative territory!
In summary: bitcoin’s pricing framework appears constructive overall maintaining crucial resistances clustered closely together hovering right around that pivotal mark located near four hundred fifty dollars ($$14400-14500). Should bulls manage successfully breach through these levels expect stronger upside trends emerging shortly thereafter depending heavily upon both macroeconomic sentiment surrounding cryptocurrency markets plus confirmation via increased volumes during upcoming sessions ahead!
Bullish Outlook:
If Bitcoin manages to close above approximately four hundred fifty dollars ($$14450-14500) coupled alongside sustained buying activity expect continued positive movement potentially reaching upwards targets ranging anywhere between twelve thousand ($$12000-$12400)! Overall momentum remains supportive while alignment amongst various forms indicates strengthening case advocating further growth prospects ahead!
Bearish Outlook:
A failure resulting from inability surpassing mentioned resistances—or sharp rejections occurring nearby—could signal beginning corrective phases pushing prices downward risks extending downwards toward ten thousand ($$10000-$10500)! Oscillators indicate signs fatigue thus breakdowns beneath certain thresholds particularly those resting underneath eleven thousand ($$113000) may further undermine any existing structures fostering belief continuing bull run persists going forward!