On September 17, Bitcoin commenced trading at $116,276, boasting a market capitalization of $2.31 trillion and a trading volume of $43.10 billion over the past 24 hours. Throughout the session, its price fluctuated between an intraday low of $114,866 and a high of $117,292, showcasing both bullish strength and selling pressure at elevated levels.
Bitcoin Analysis
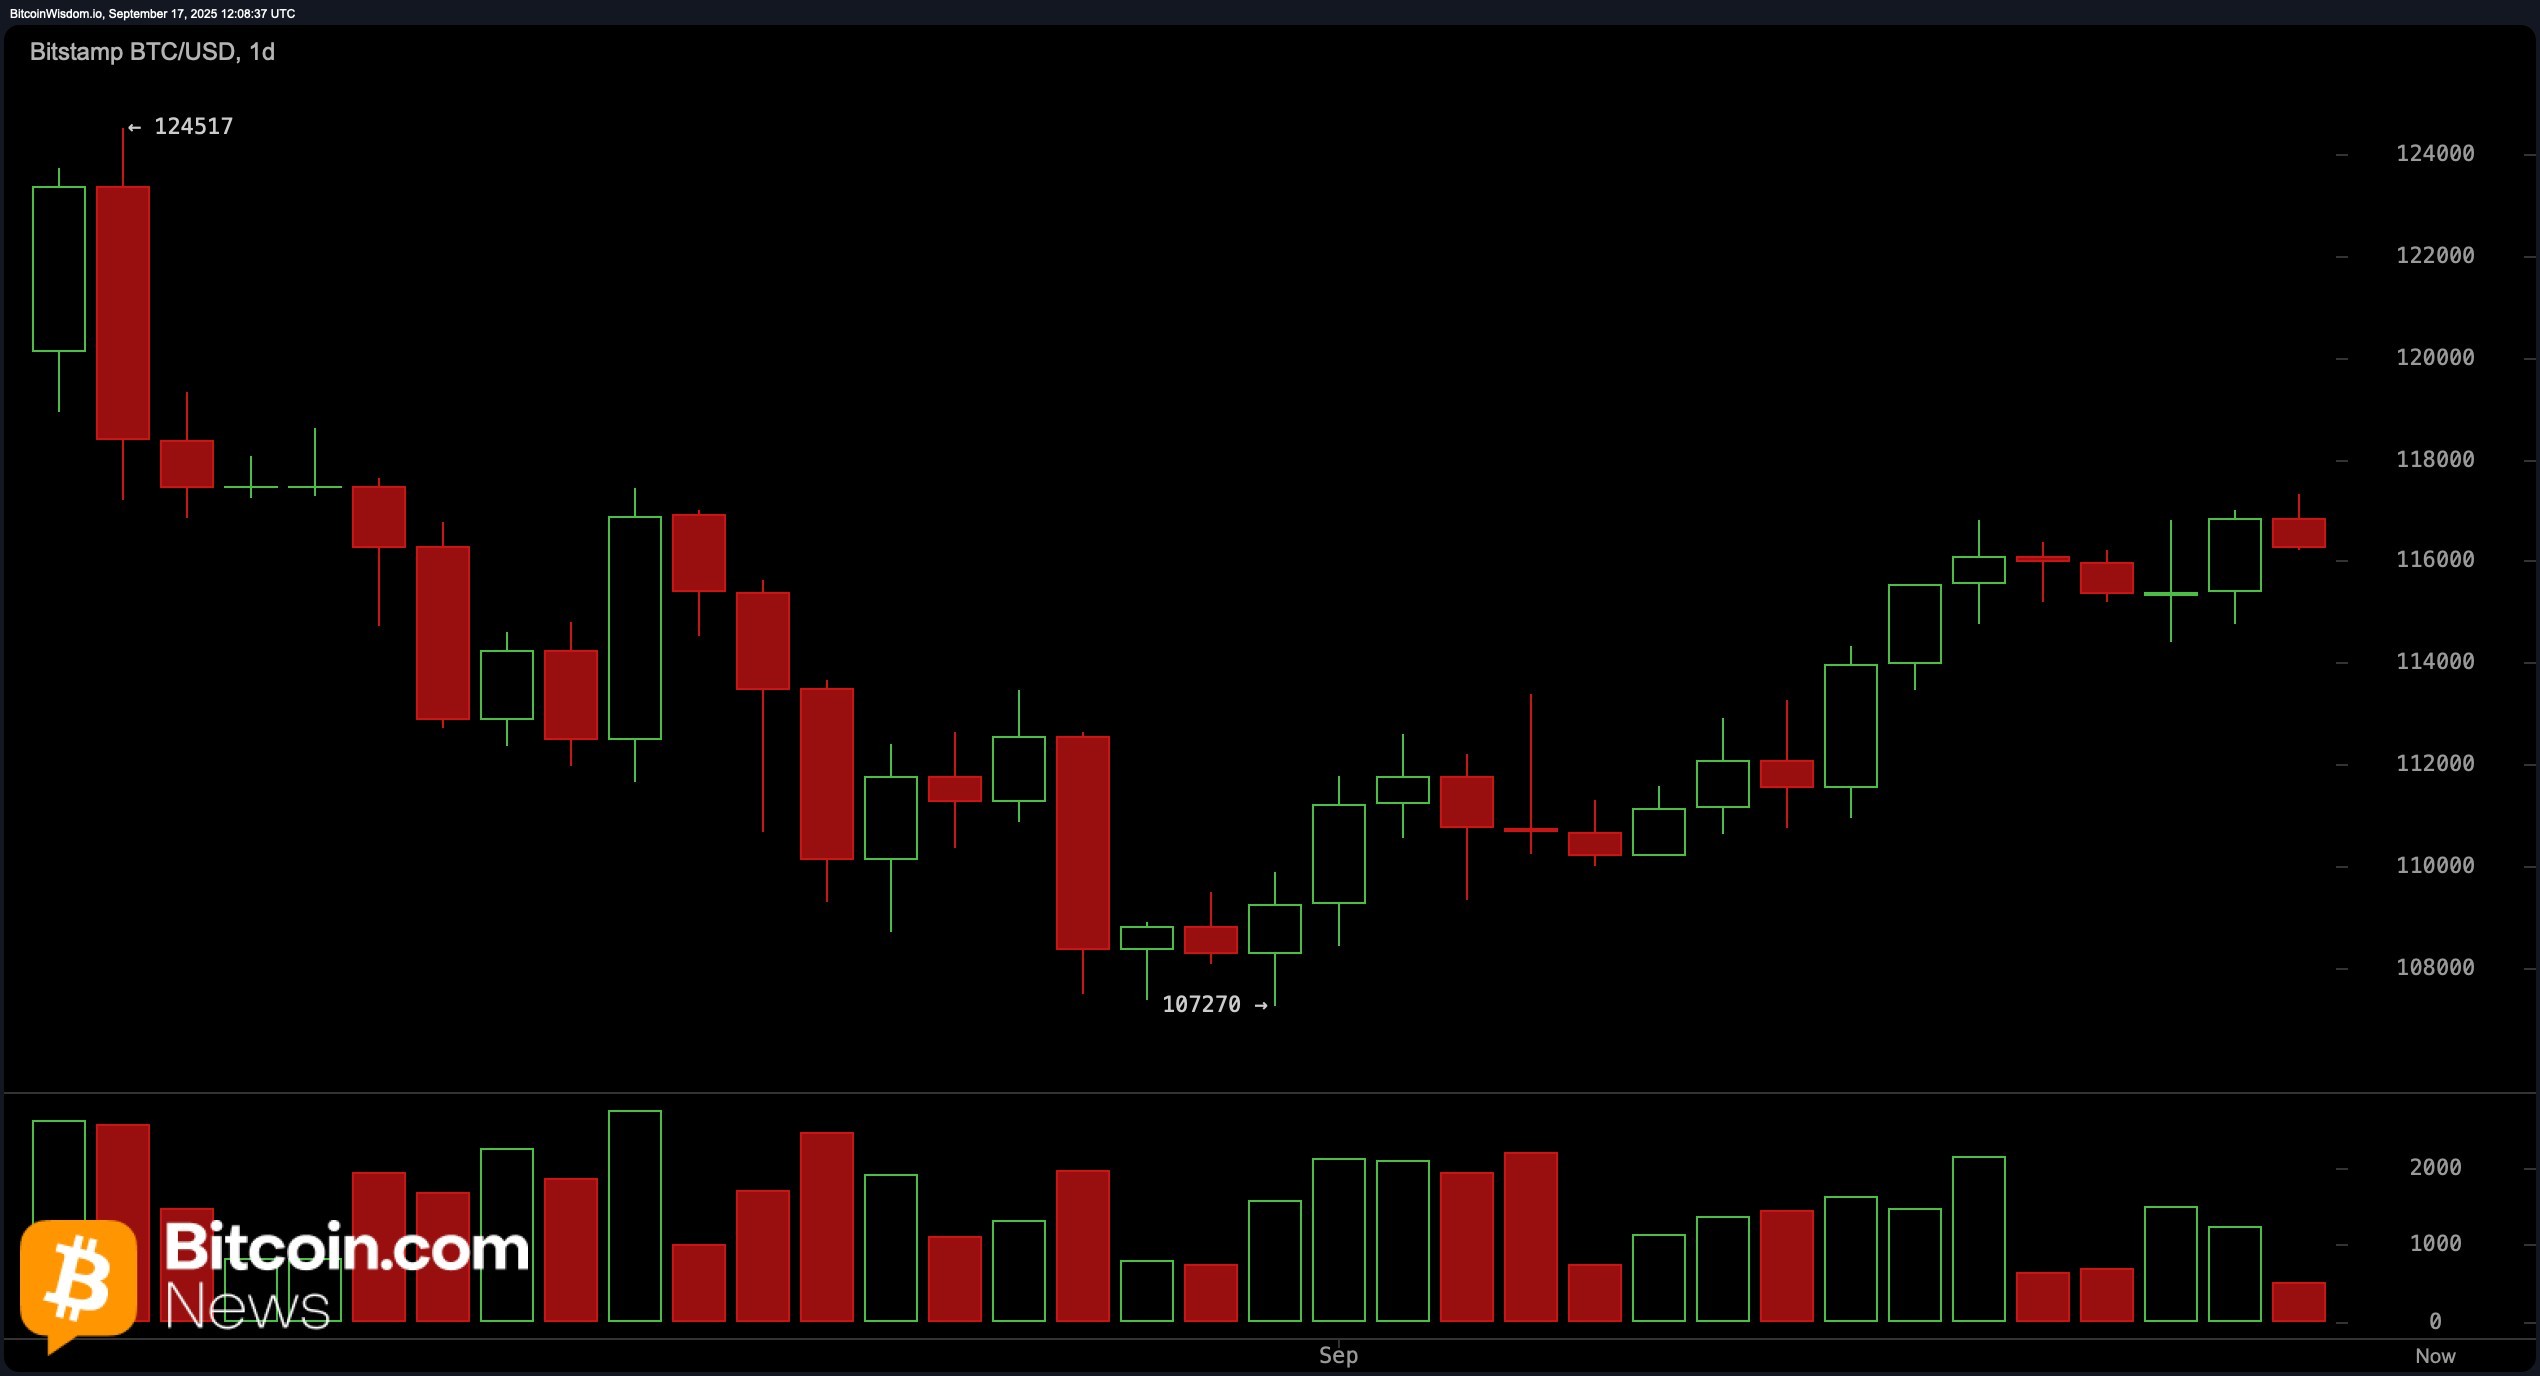
The daily chart indicates that Bitcoin is currently consolidating just beneath the resistance level at $117,500 after bouncing back from a local low of $107,270. Although this recent ascent appears technically promising, diminishing volume during the rally suggests that bullish momentum may be losing steam.
Key support lies in the range between $112,000 and $114,000; any pullback to this area could entice renewed buying interest. Traders might want to wait for a dip into this zone accompanied by a strong bullish reversal before considering long positions. A breakout above the resistance level at $117,500 would require significant volume to validate its strength.
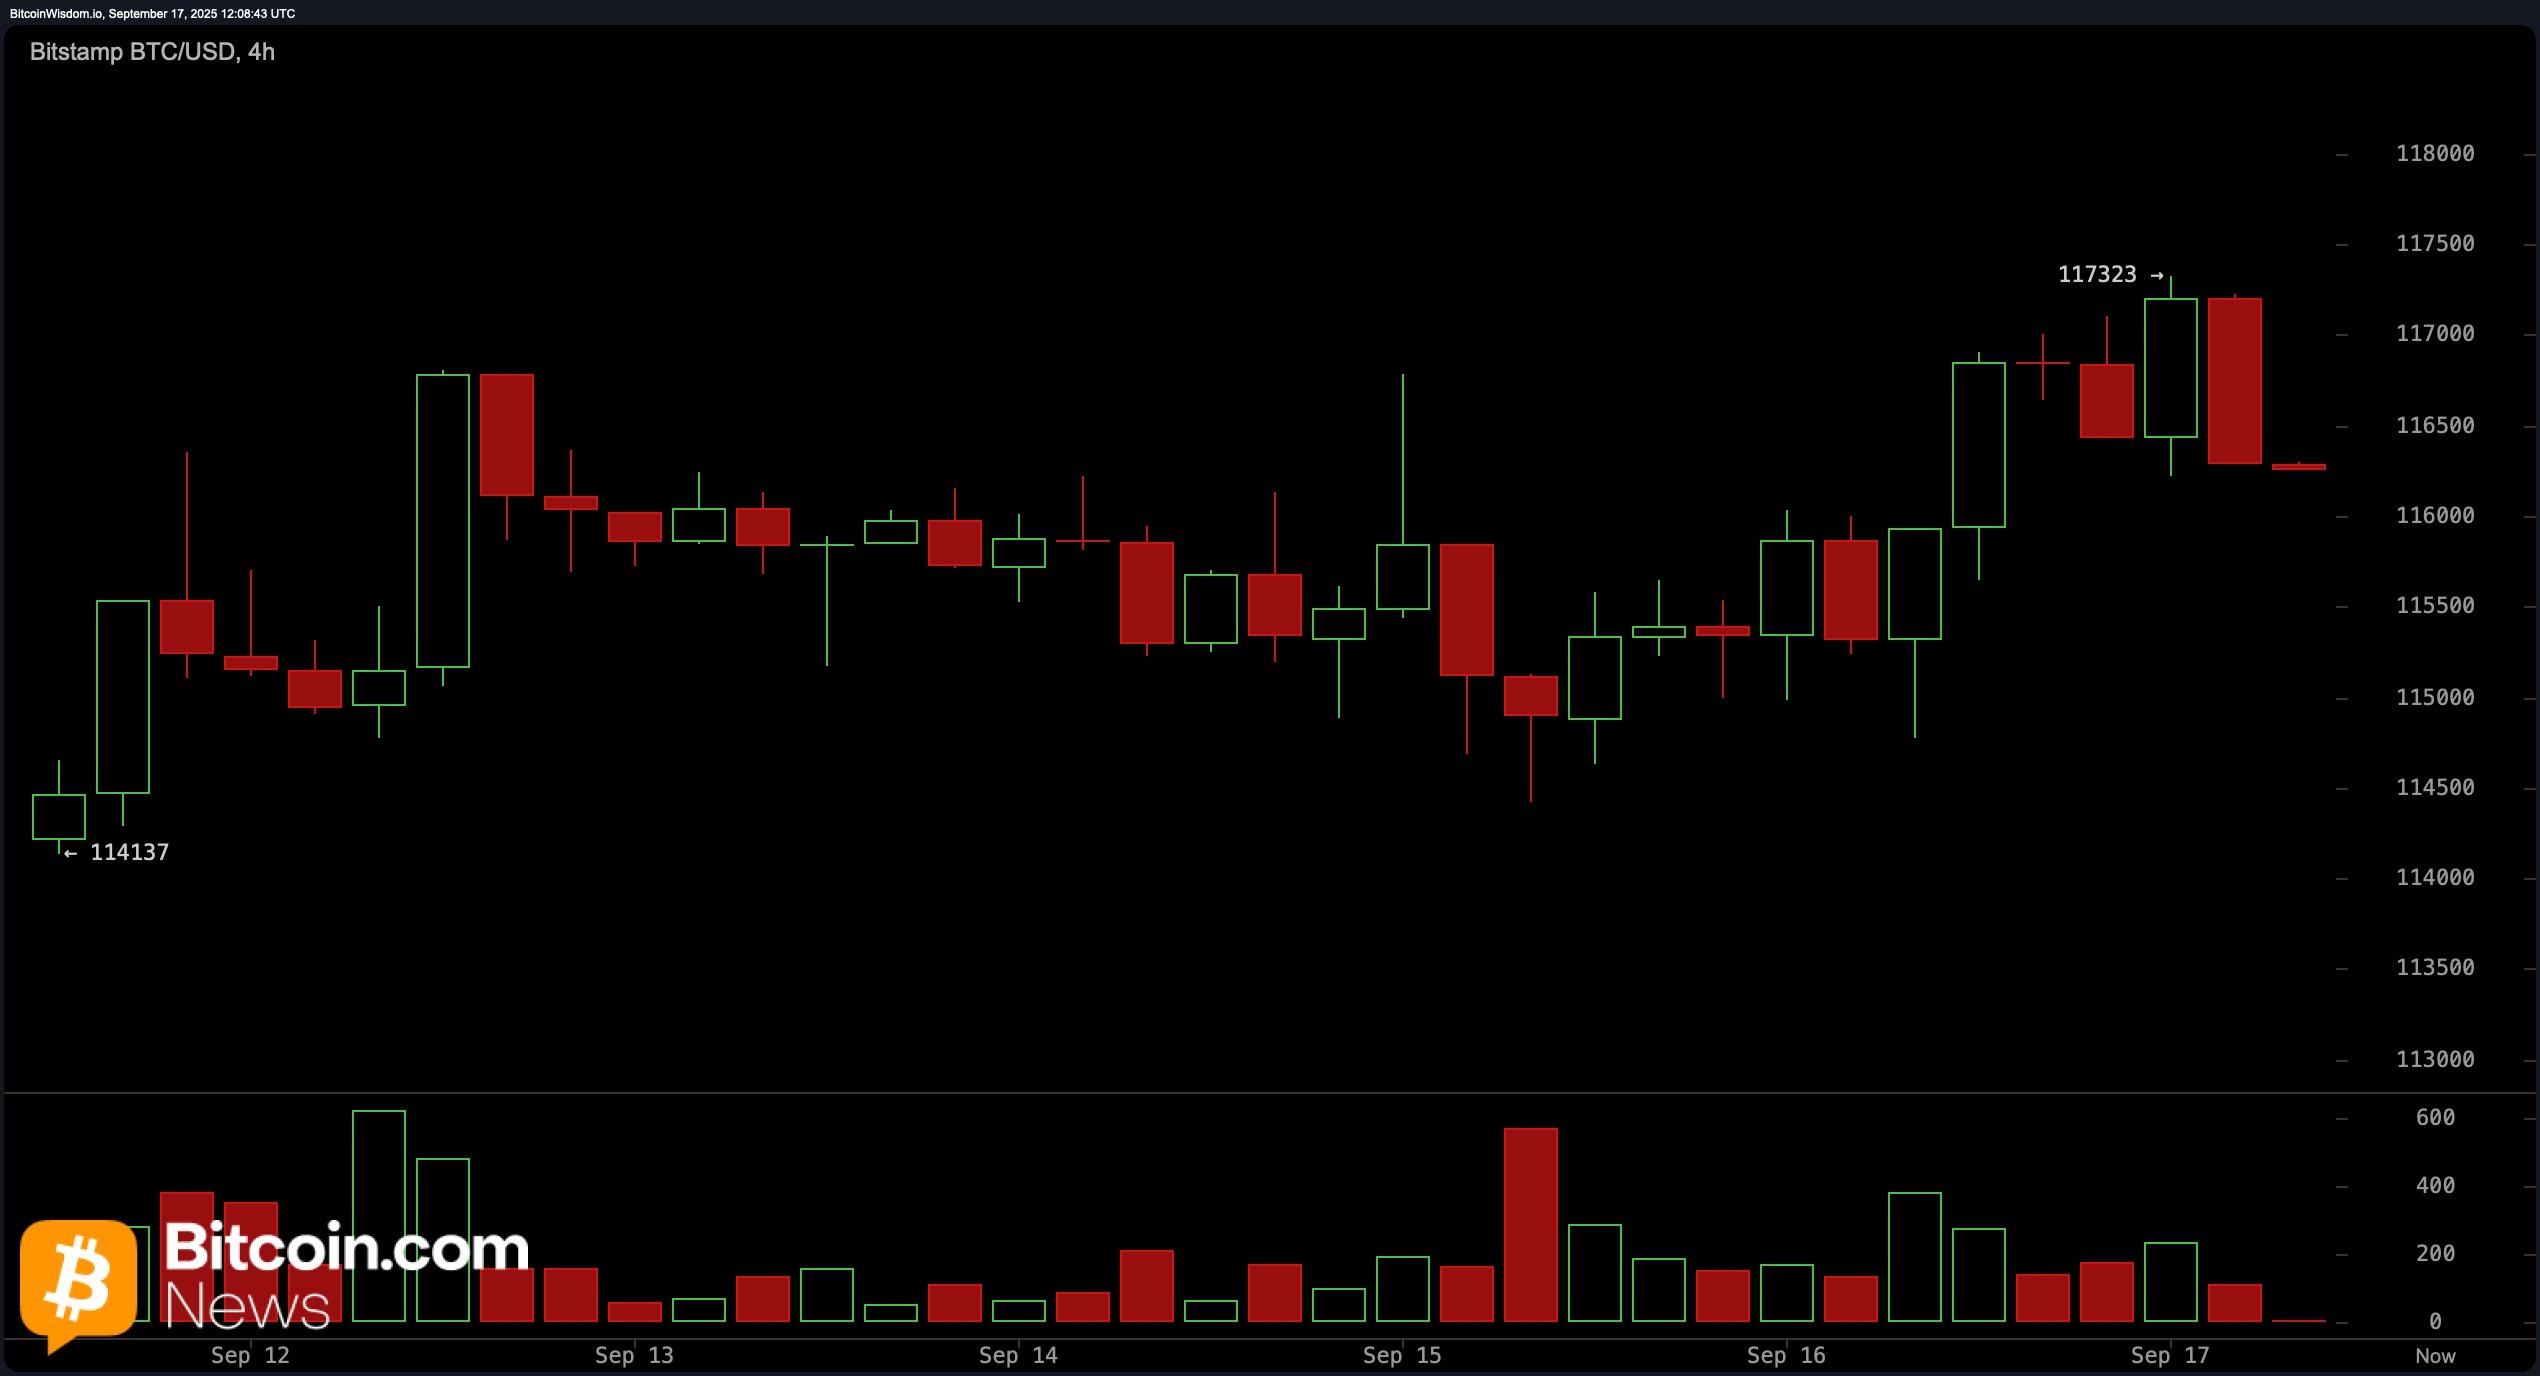
The 4-hour chart presents a more cautious perspective following an abrupt surge from around $114,137 to approximately $117,323. A bearish engulfing candle has formed post-recent peak alongside an increase in red volume—indicating robust overhead resistance and potential for short-term correction. The area between roughly $115,200 and$115 ,500 could act as a bounce zone if buying pressure resurfaces; however ,the lack of follow-through above$117 ,000 may constrain immediate upside potential .Unless price action decisively clears recent highs with accompanying volume support ,the outlook remains tentative .
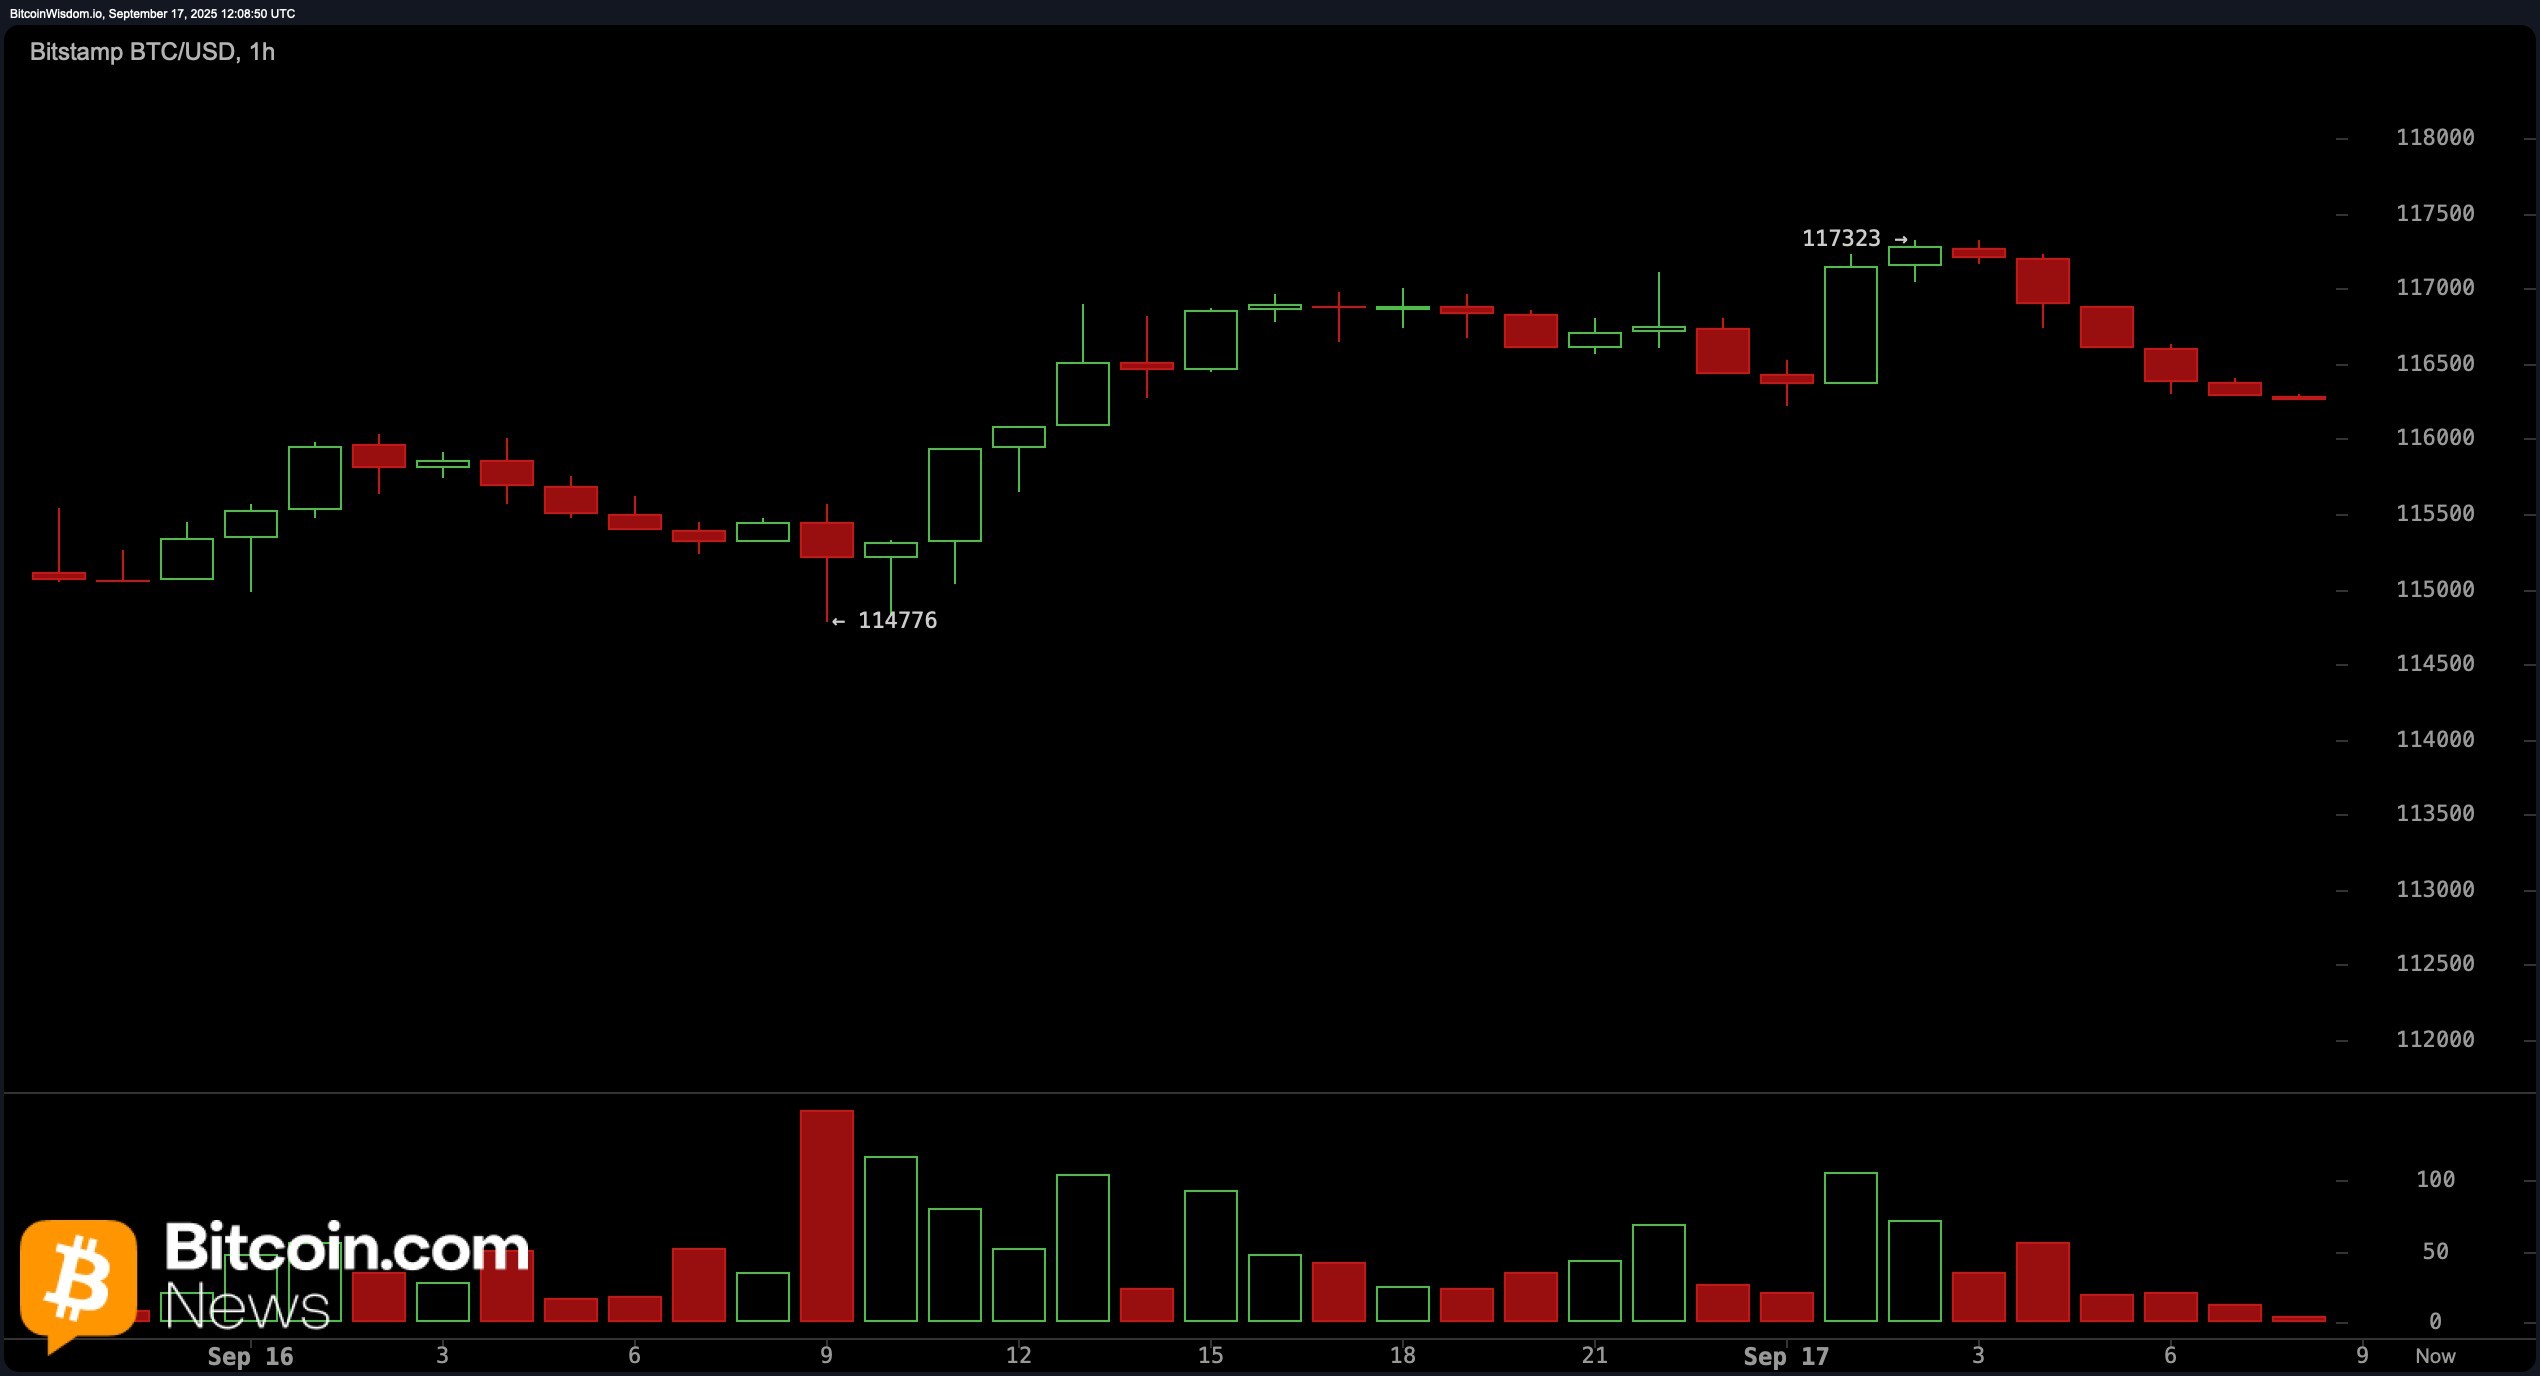
From a short-term viewpoint on the hourly chart ,Bitcoin’s upward structure has broken down with lower highs emerging — signaling weakening momentum .While minor support exists near$115 ,800-$116 ,000 range,recent red candles indicate insufficient buyer defense .Any prospective scalp long trade around these levels would necessitate clear bullish reversal patterns such as hammer candles coupled with increasing volumes.Take-profit targets should be capped around$116 ,800-$117 ,000 unless there’s notable change in volumes.
Oscillator indicators reveal indecision within market sentiment.The relative strength index (RSI) stands at58 reflecting neutrality while Stochastic oscillator reads89 also indicating neutral conditions.Significantly,the commodity channel index (CCI) shows115 along with momentum reading5114 both signal bearish trends suggesting overextension.The average directional index(ADX) registers18 pointing towards weak trend strength.Nonetheless,moving average convergence divergence(MACD) remains positive sitting763 indicating limited downside risk without structural breakdowns occurring.
The moving averages continue supporting broader uptrend dynamics.The10-period exponential moving average(EMA)and simple moving average(SMA )are positioned respectively at$114950and$114906.All major EMAs/SMA’s ranging from20to200periods are aligned favorably reinforcing medium-term bullish bias despite shorter term actions appearing cautious.Should supports near$115500 fail then retesting levels close or below($14000becomes increasingly probable.
Bullish Outlook:
Despite signs showing decreasing momentum across lower timeframes,Bitcoin maintains technical backing through solid stacks comprising multiple moving averages alongside favorable MACD signals.If prices sustain above zones spanning ($15200–($15500),with confirming volumes witnessing rebounds,a breakout surpassing(17500could reinstate upward trajectories targeting new peaks ahead!
Bearish Outlook:
Short-lived technical indicators suggest escalating selling pressures combined weakening strengths particularly highlighted via bearish engulfments observed on four-hour charts & oscillators signaling either sell or neutral stances.In case ($15500support fails holding ground then revisiting lows approaching($14000may jeopardize recently witnessed rallies risking larger corrections looming ahead!