
On September 19, 2025, Bitcoin was valued at $116,393, resulting in a market capitalization of $2.31 trillion and a trading volume of $36.67 billion over the last 24 hours. The cryptocurrency’s price fluctuated between $116,349 and $117,888 during the day, indicating a period of tight consolidation near critical resistance levels.
Bitcoin
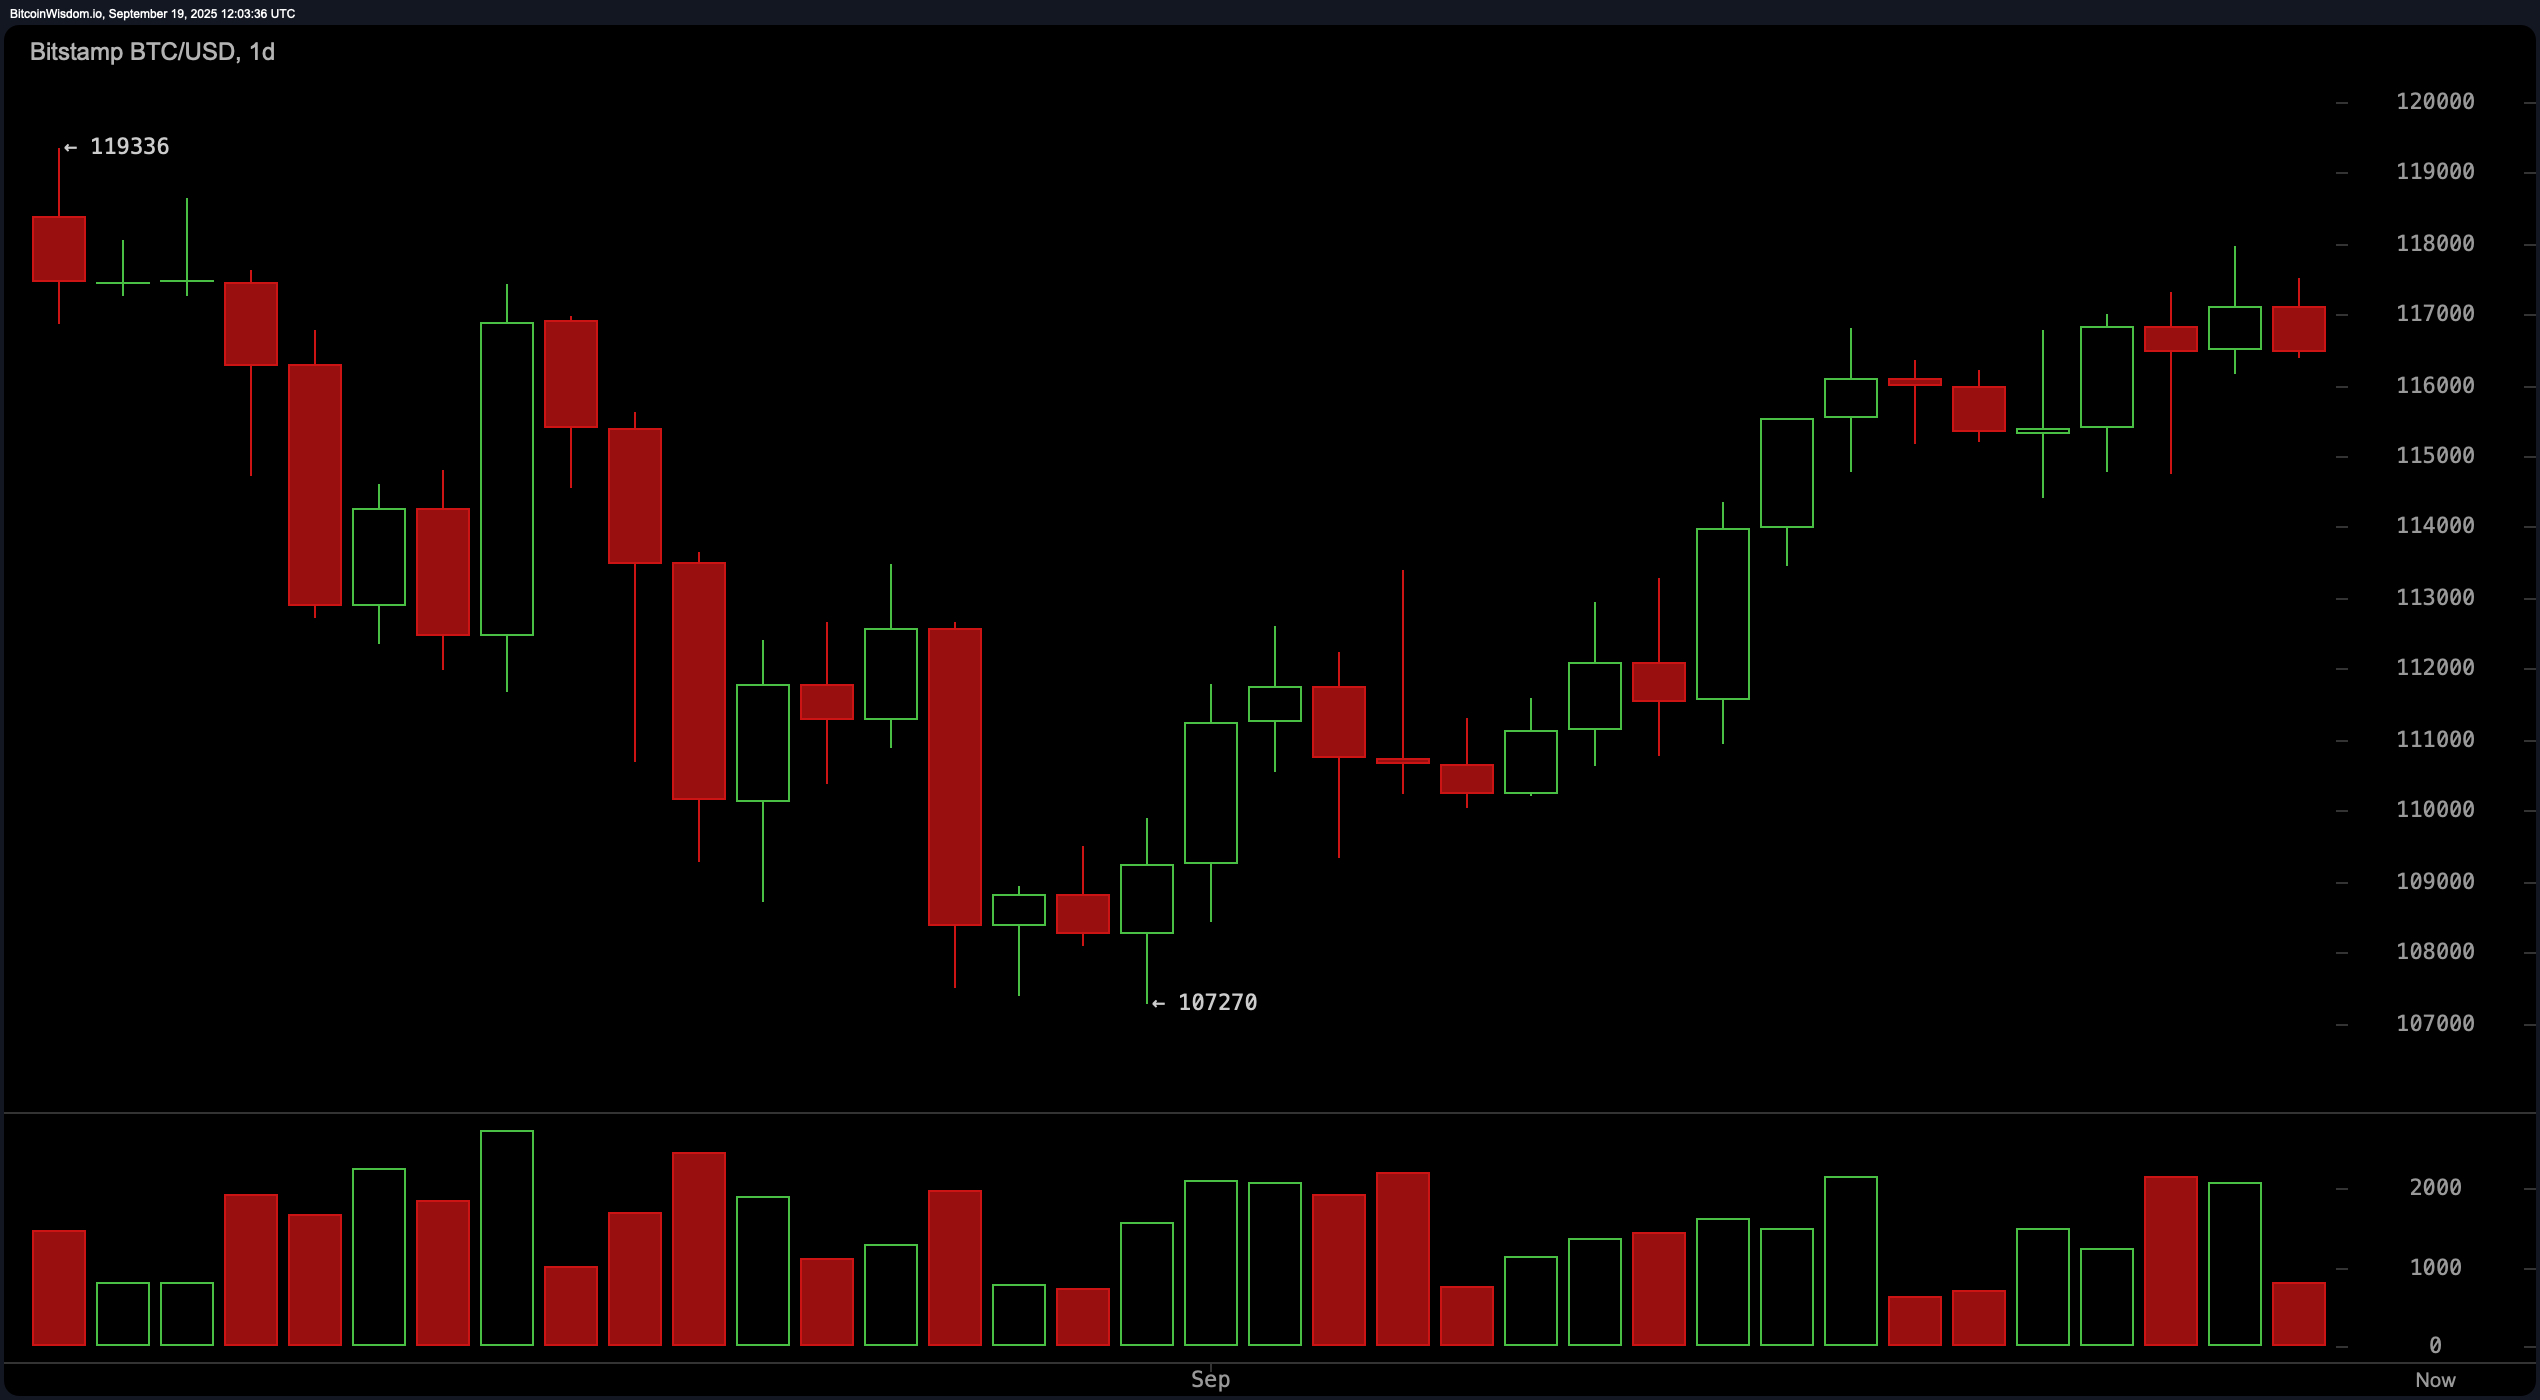
The daily chart reveals that Bitcoin has been on an upward trajectory since early September after rebounding from the support level at $107,270 where it formed a double-bottom pattern. Since that point, prices have consistently risen but are currently facing significant resistance just below the key level of $119,336.
While the uptrend is still valid, recent price movements around the range of $117,000 to $118,000 suggest some uncertainty among traders. There has been a slight increase in trading volume during upward movements; however, recent candlestick patterns indicate caution as prices approach overhead resistance levels. Important buying zones are identified between $113,500 and $114,500 with optimal profit-taking targets set between $118,000 and $119,500 while placing stop-loss orders below the level of$111,000.
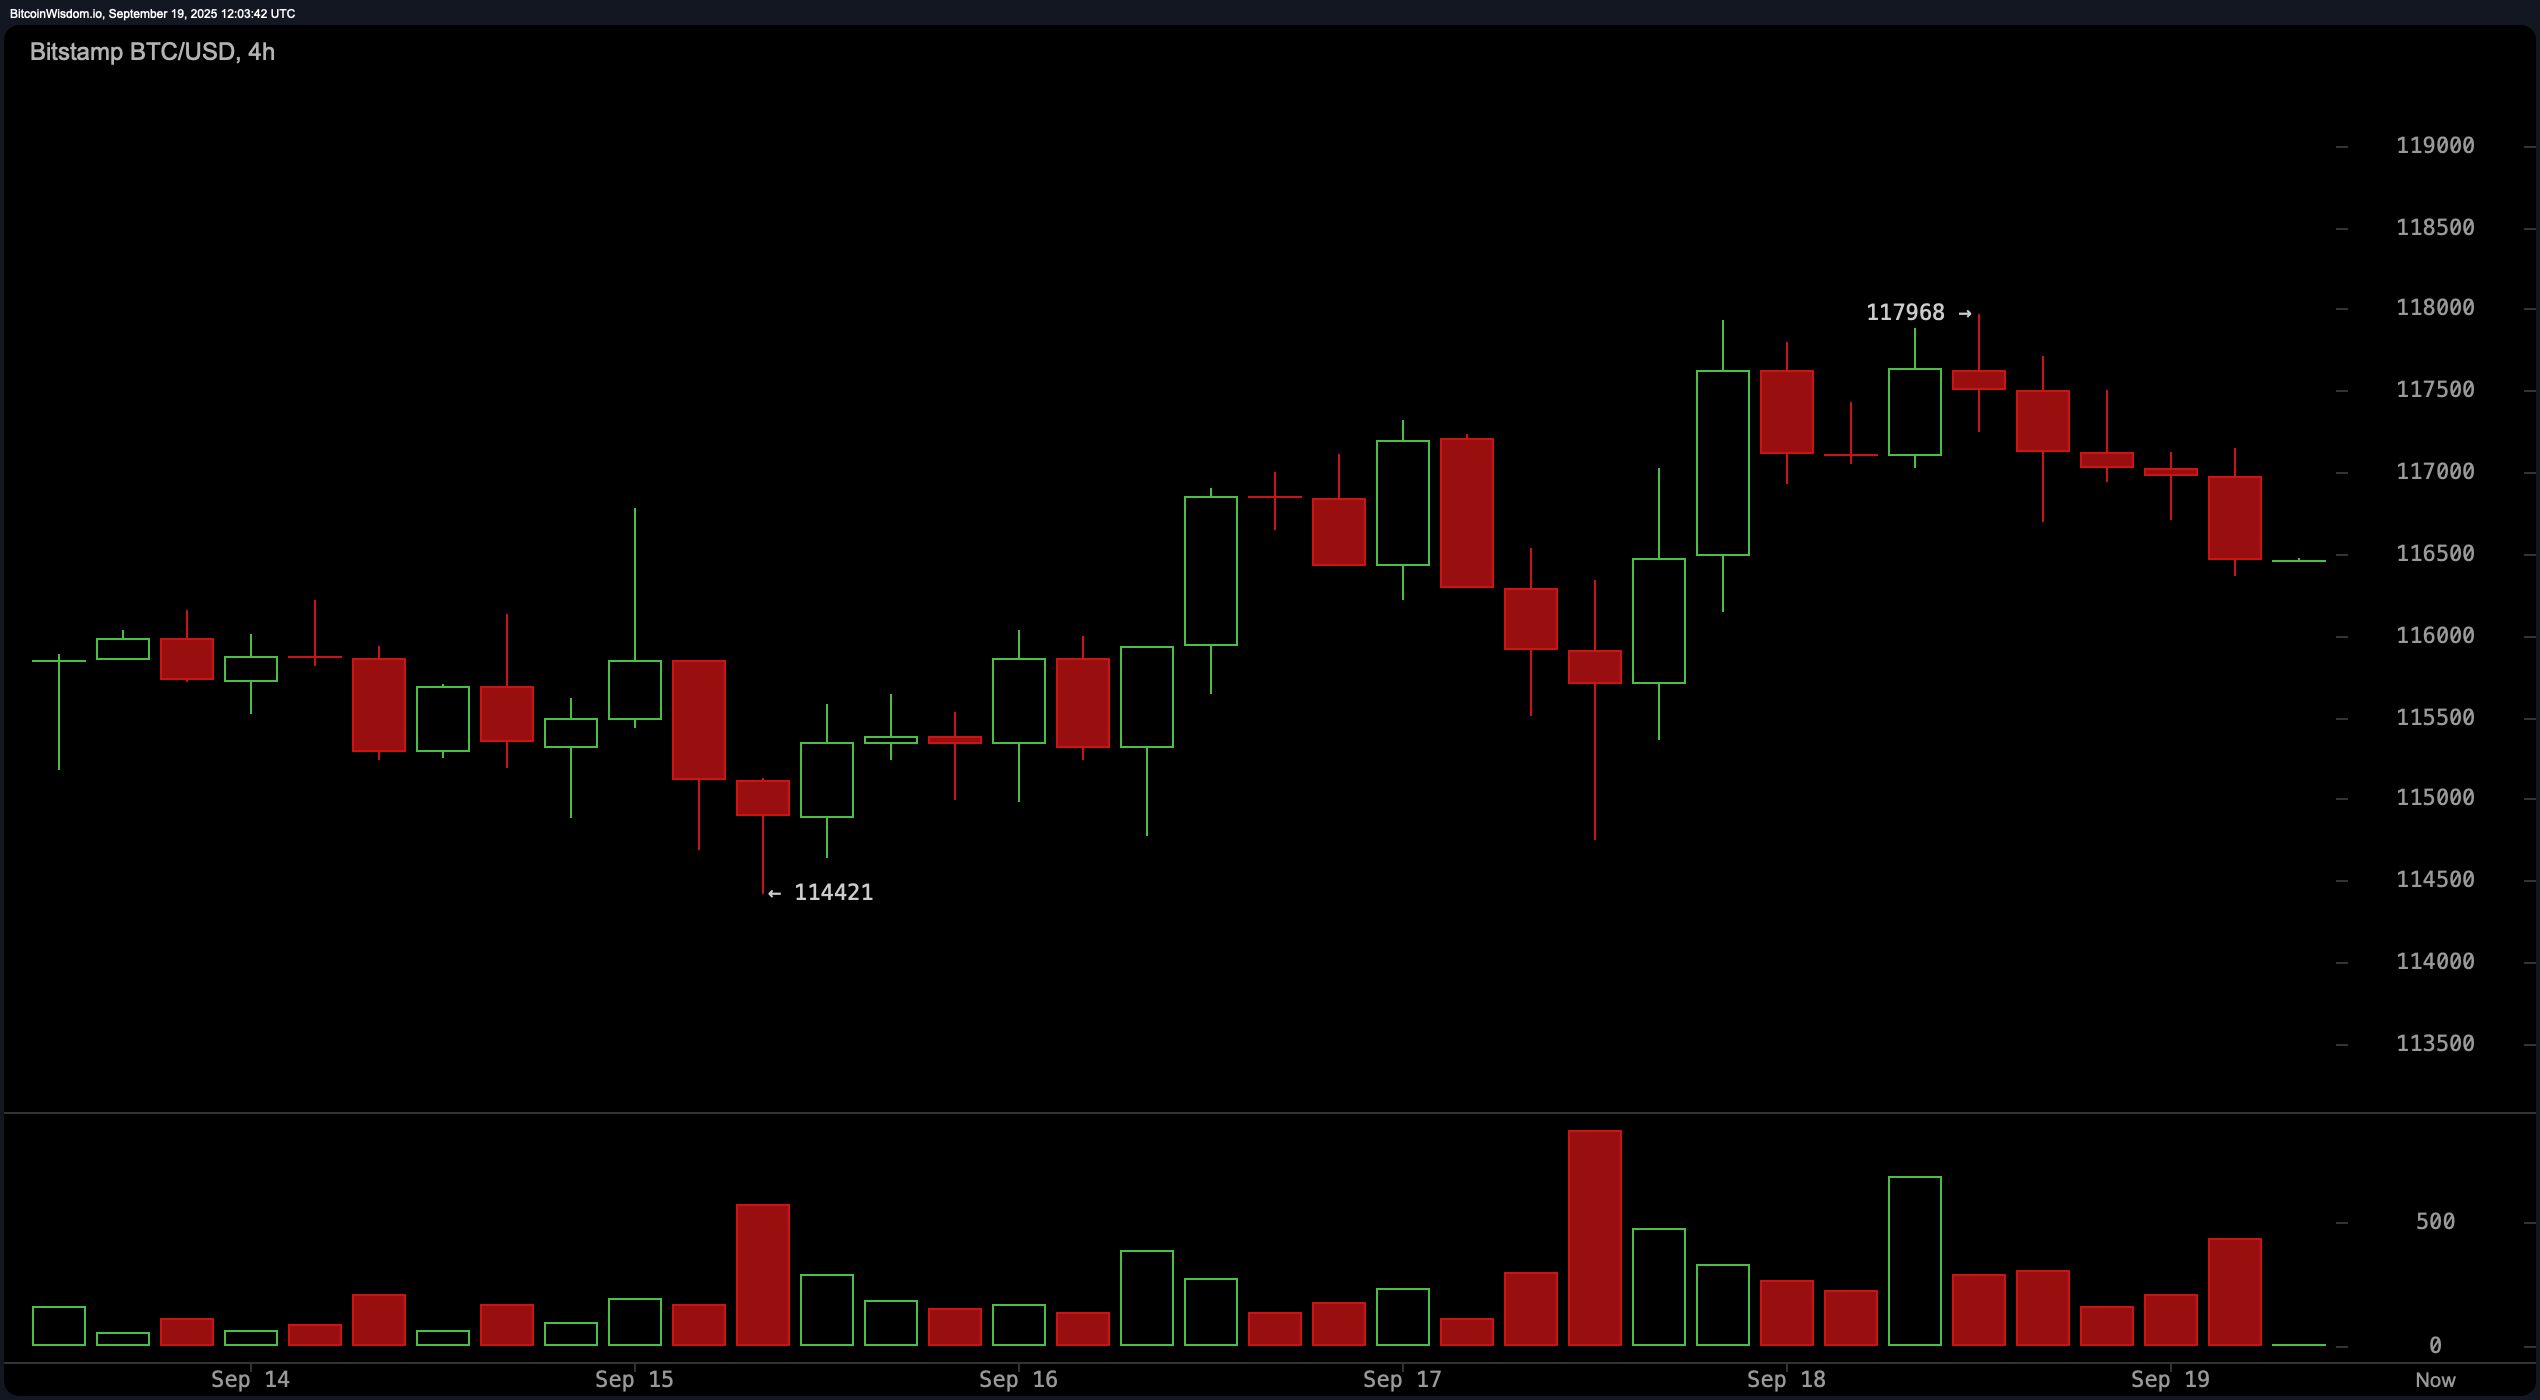
The four-hour chart indicates that Bitcoin recently reached its peak at around$117,968 before experiencing a decline characterized by several bearish candles showing reduced momentum. This shift was accompanied by an increase in selling volume suggesting potential short-term distribution phases may be occurring. Nevertheless,the overall structure remains supportive with strong previous support observed near$114,421.The asset is expected to retest areas around$115,000–$115,500 before continuing its broader trend.Traders monitoring this area for bullish reversal signals could find favorable risk-reward opportunities targeting gains towards$117\,500–$118\,000 while setting protective stop-losses at approximately$114\,000.
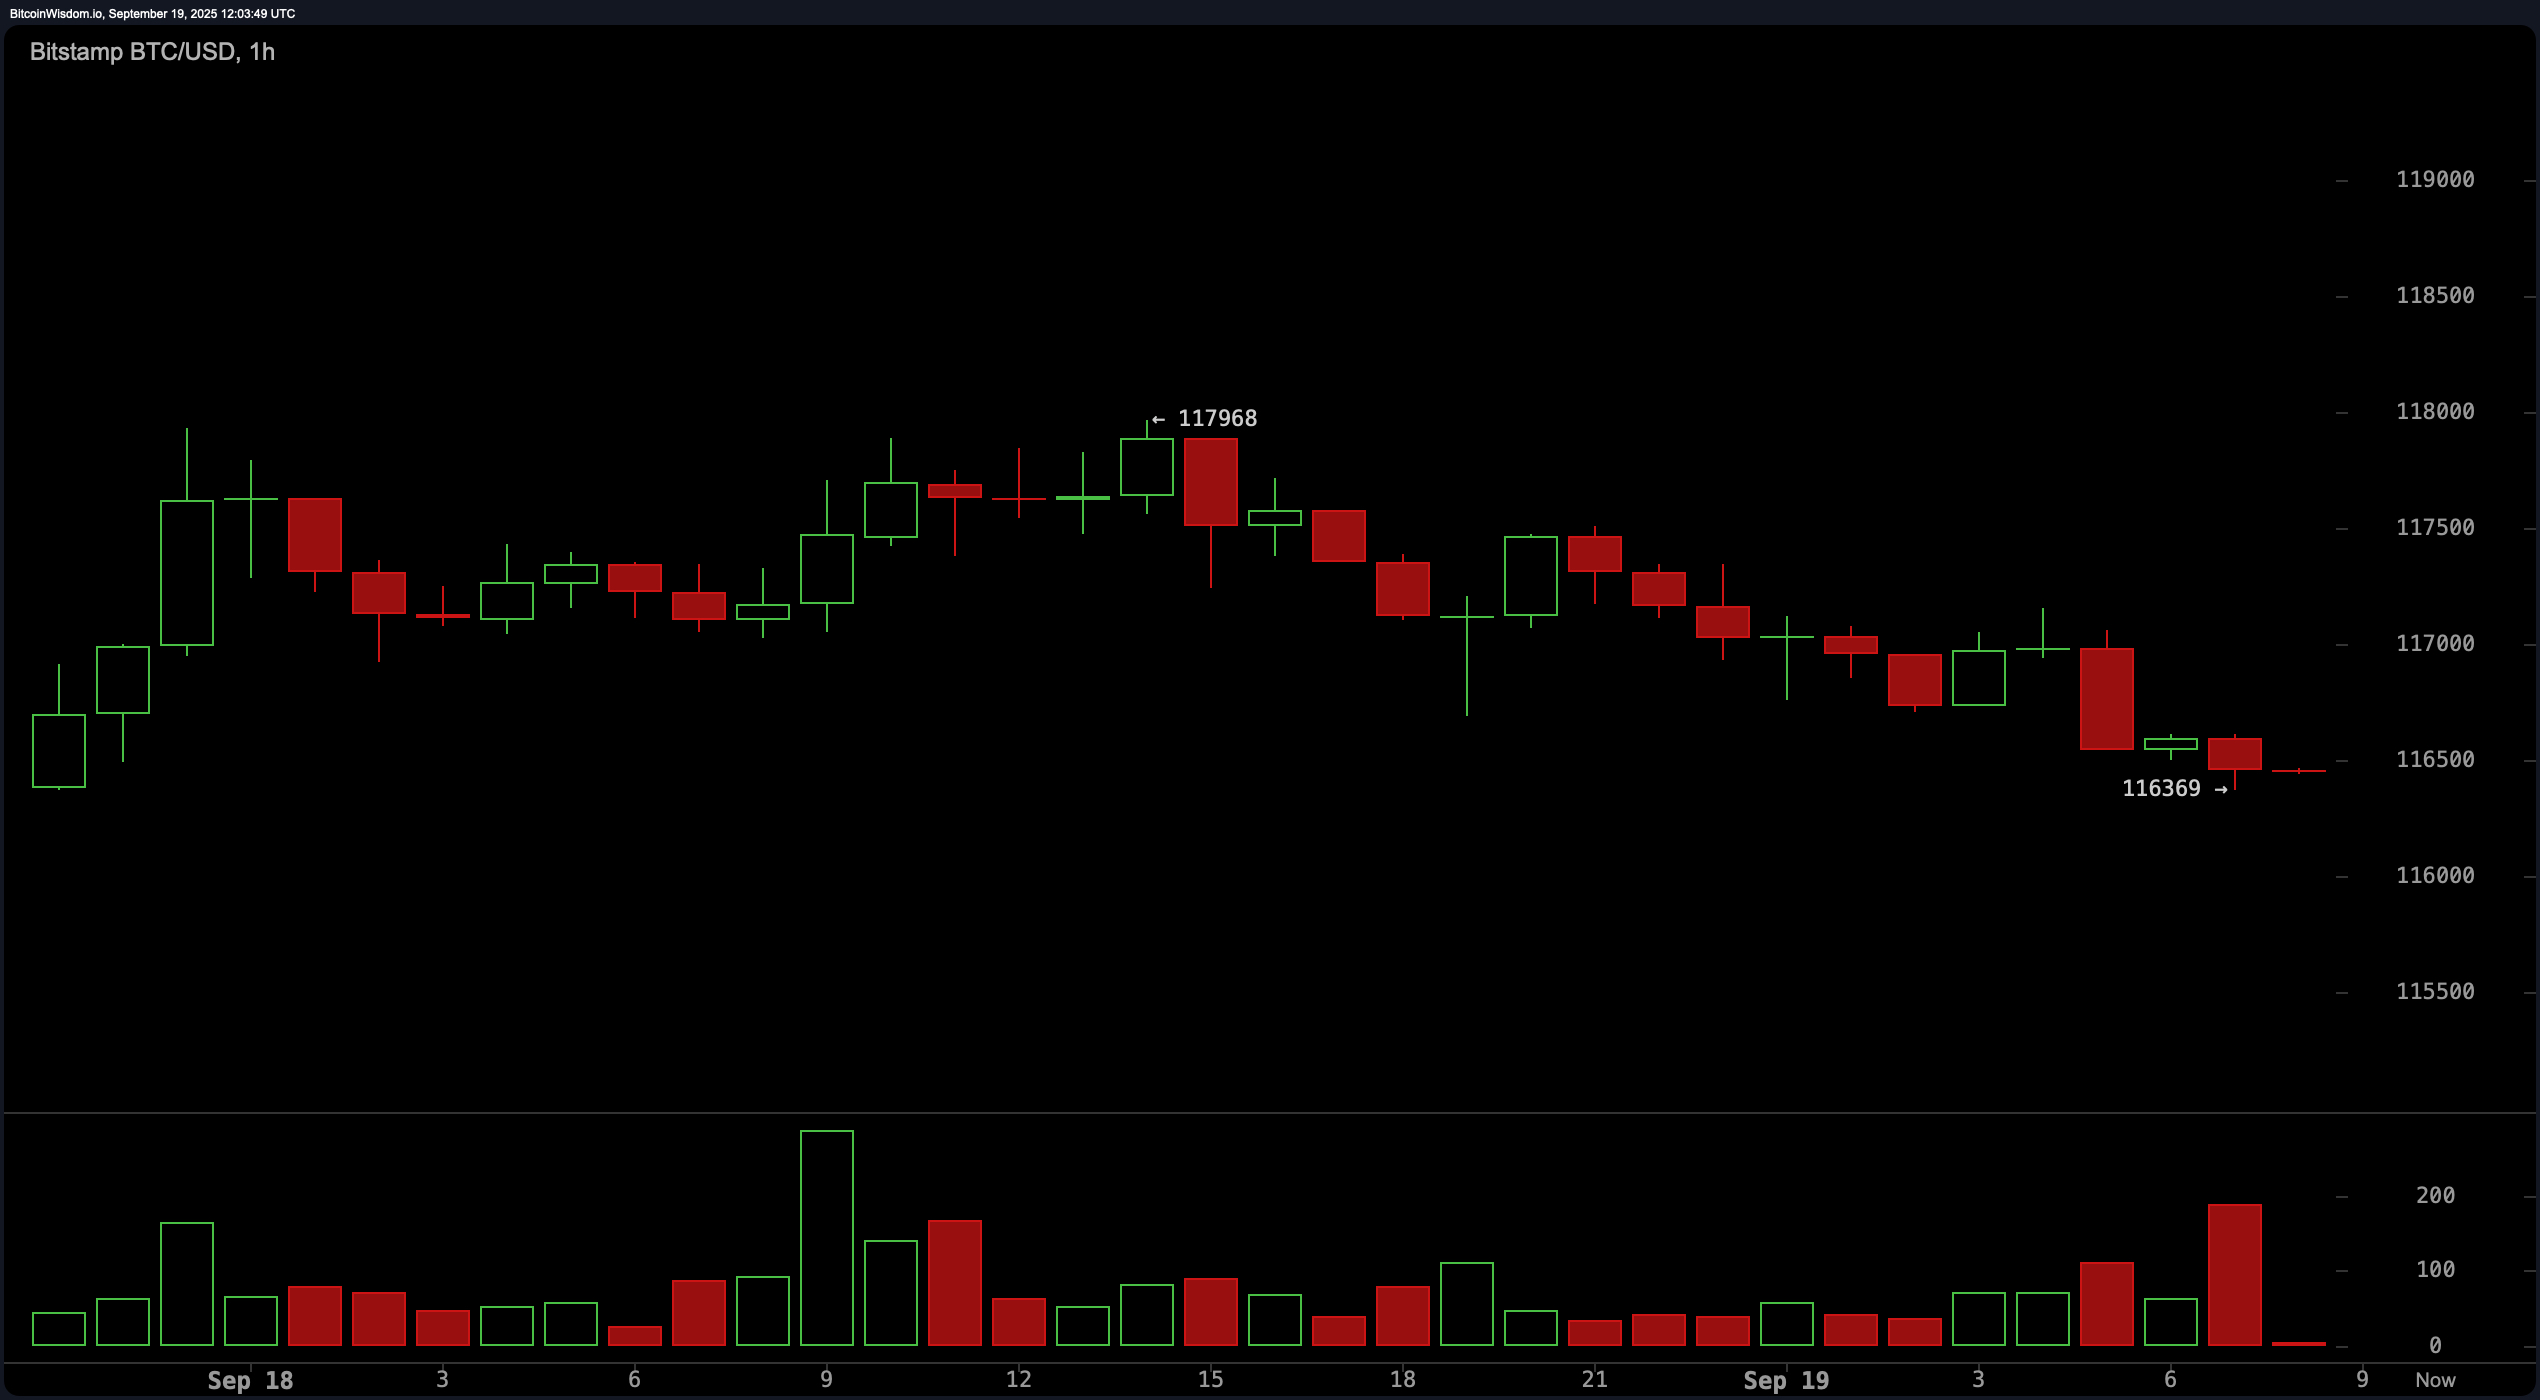
The one-hour chart for Bitcoin displays clear signs of short-term downtrends marked by successive lower highs and lows following its peak at approximately $117、968.Recent activity saw prices touch around 116、369 brushing against minor support levels.This movement appears corrective within what seems like an overarching bullish framework seen on higher timeframes.Volume is gradually increasing on sell-side trades further confirming this retracement phase.Unless we see robust bullish action forming close to the 116、000 mark immediate long positions should be avoided.A tighter entry range between 116、000-116、300 could be considered if upward momentum resumes with suggested exits placed around the target zone ranging from 117、000-117、500 along with stop losses positioned beneath 115،700。
When analyzing key technical indicators oscillators present mixed signals.The relative strength index (RSI) currently sits at58 reflecting neutral momentum conditions.Stochastic readings show overbought territory registering87 indicating possible sell-off risks.Meanwhile commodity channel index (CCI) reads95 alongside average directional index(ADX)at19 both signaling indecisiveness.On another note awesome oscillator shows3\185 maintaining neutrality.Notably,momentum(10)is displaying bearish indications clocking inat4\930 while moving average convergence divergence(MACD)is holding steady positively registering961.
Moving averages provide clearer directional insights as all major short-and long-term averages point towards continued bullishness.Exponential moving average(EMA)and simple moving average(SMA)for periods10、20、30、50、100,and200 align beneath current pricing showcasing strong underlying trend support.Current EMA(10)is locatedat115575whileSMA(10)sits slightly higherat115924 both reinforcing positive outlooks.Additionally longer-term MAs suchasEMA200currently positioned105738andSMA200hovering103240 bolster optimism regarding future performance trends overall .
In summary despite maintaining technical strength across daily timeframes caution must prevail amidst signs hinting fatigue emerging within shorter intervals.Ideal entry points now rely heavily upon confirmations surrounding lower timeframe supports particularly within ranges spanningbetween115k-116k.A breakout surpassing118k supportedbyvolume would invalidate ongoing consolidation theories reinstating momentum neededto pursue new highs ahead .
Bull Verdict:
The structural posture for Bitcoin remains firmly bullish underlined by consistent backing from all primary moving averages coupledwith well-established upwards trends visibleon daily charts.Shouldprices sustain abovecriticalzones105K -106K whilst breakingthroughresistanceof118K backedbyvolumewould likely propel us toward120K+targets shortly thereafter!
Bear Verdict:
Even though there exists solid trends evident throughout daily metrics pressures arisingfromimmediate resistances pairedwith weakeningmomentumonlowerchartscould pose threats.Failuretoreclaimlevelsaround13700 convincingly alongsidebreakdownsbelowkeythresholdsof15000may triggerdeeperretracements potentially reaching13000 underminingrecentuptrends! </P