
On September 12, 2025, Bitcoin was trading close to the upper limit of the day’s range, fluctuating between $114,834 and $115,269 as traders assessed momentum against established resistance levels.
Bitcoin Overview
The daily chart for Bitcoin indicates a recovery from an early September dip around $107,270. The price is gradually climbing towards the resistance zone of $116,500 to $118,000 that previously capped rallies in August. This upward trend is characterized by a series of higher lows and higher highs; however, participation has diminished during this latest surge. Therefore, confirmation is necessary before anticipating further upward movement. A significant daily close above $118,000 could pave the way for a rise to $124,000; conversely, failing to surpass this level may lead to a pullback toward support levels between $113,500 and $114,500 established by recent declines.
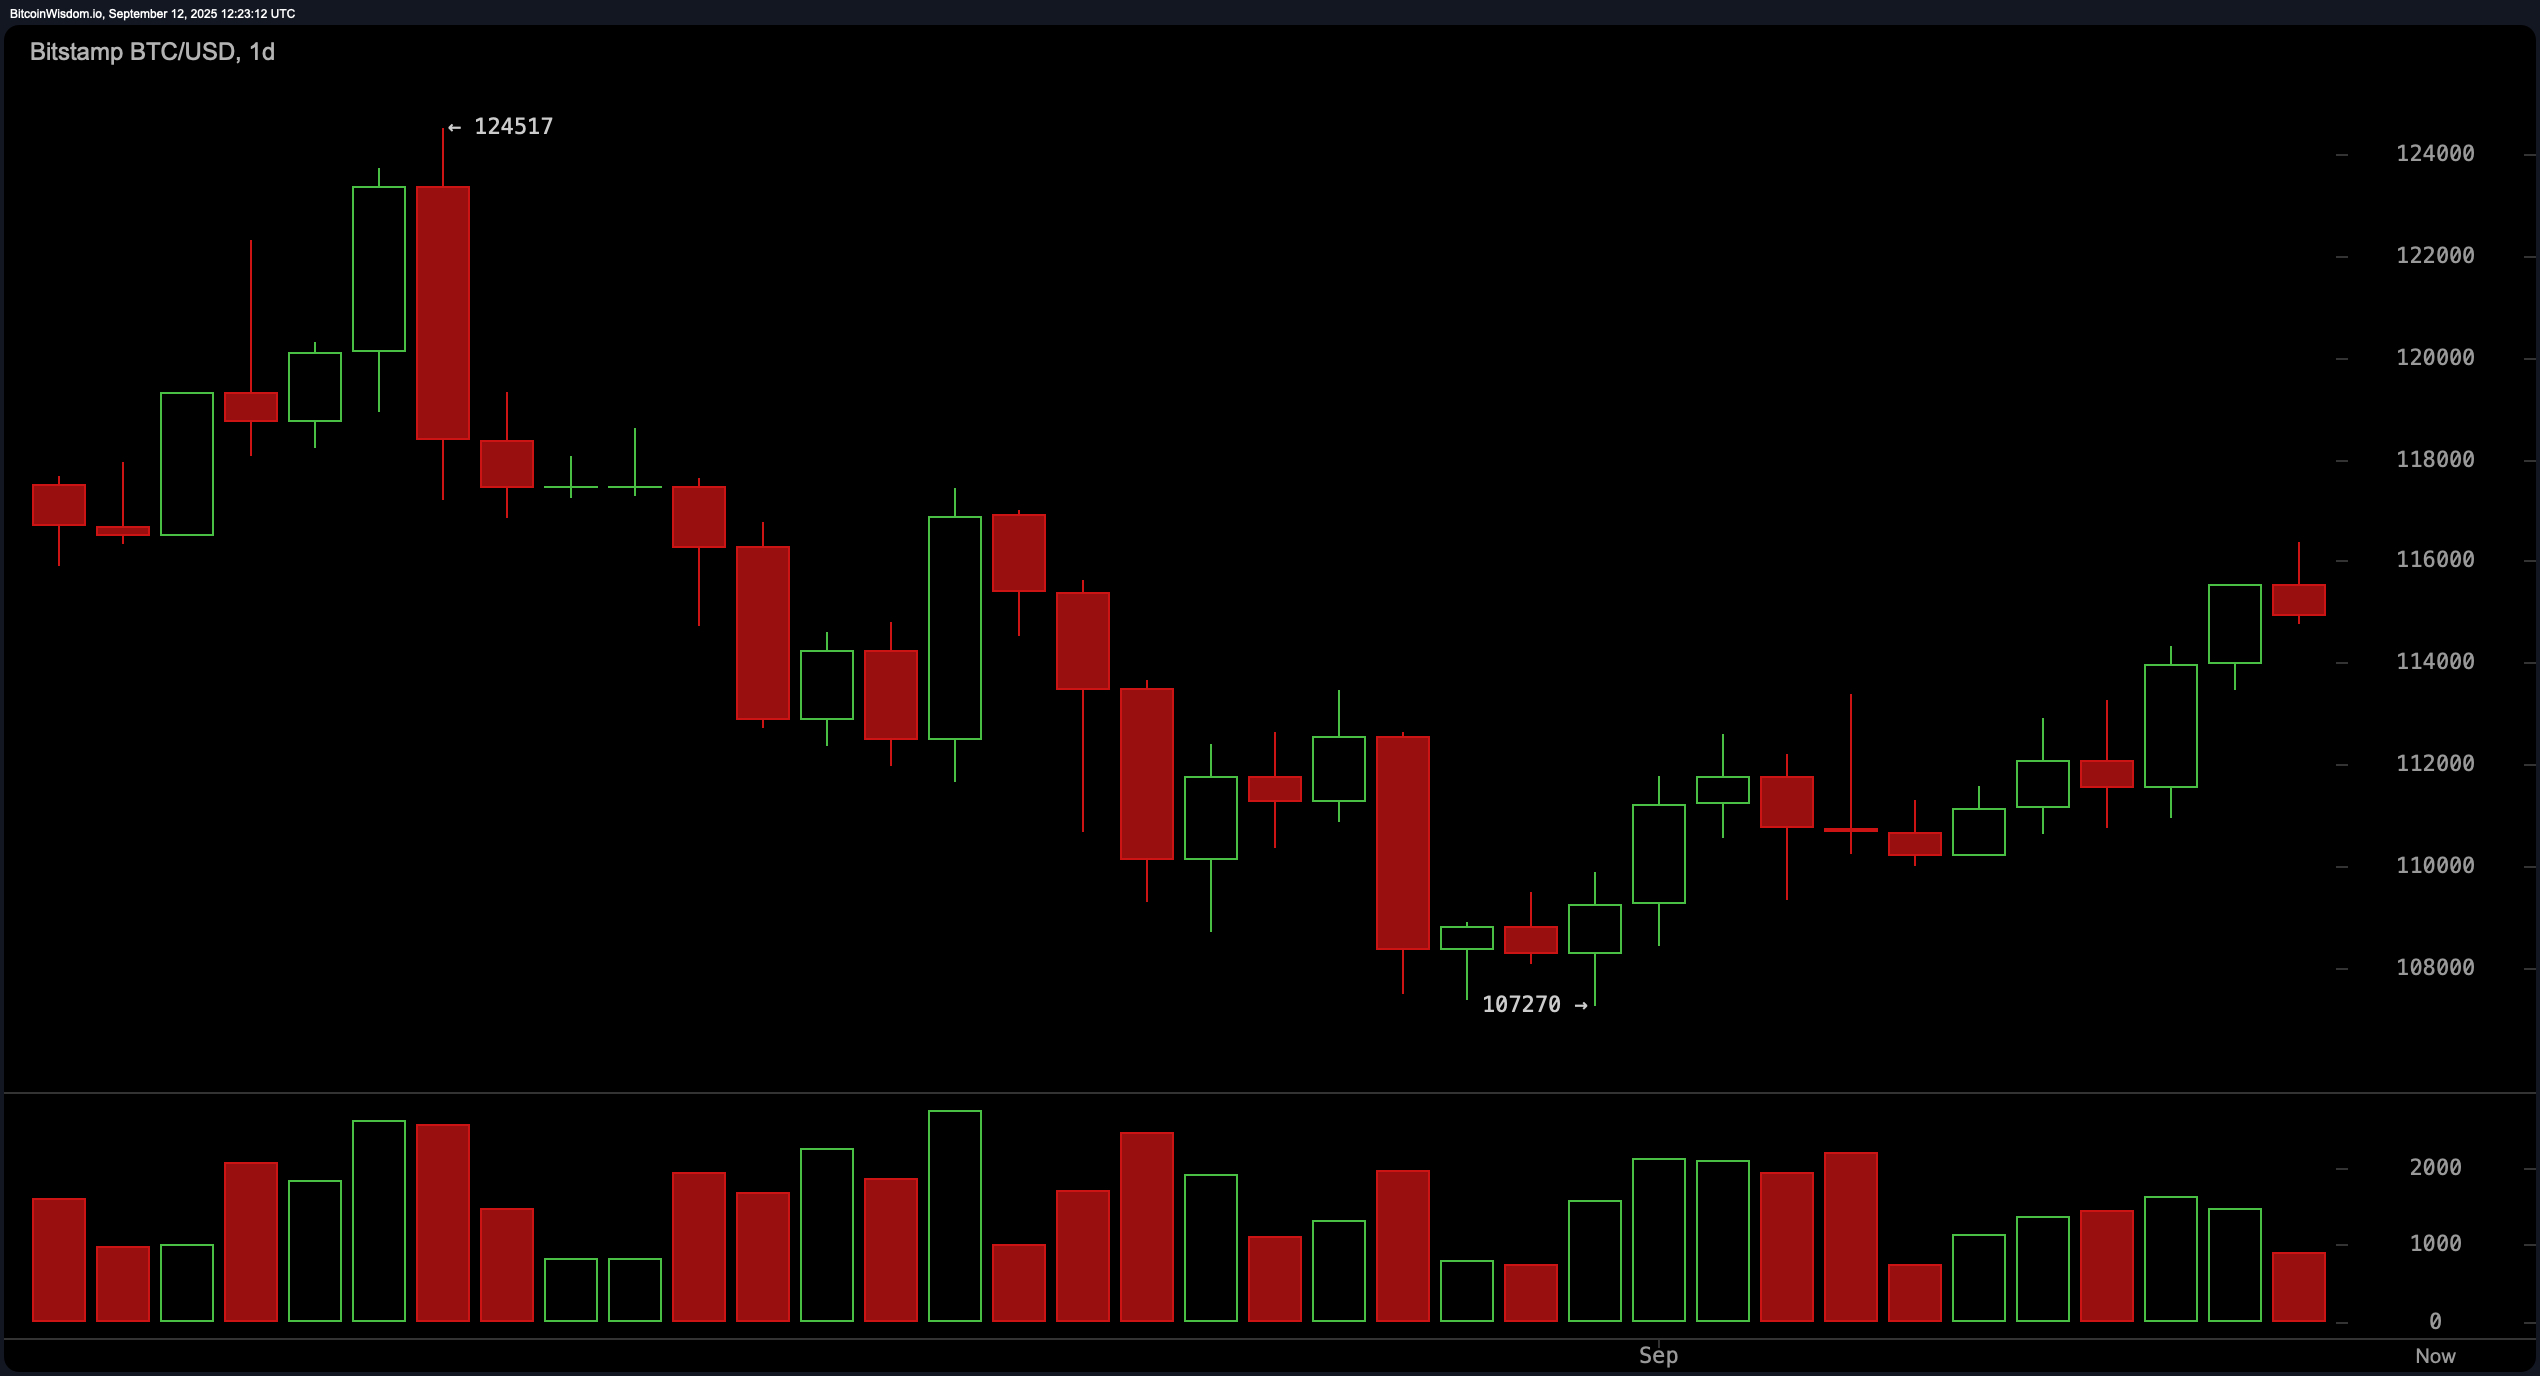
BTC/USD Daily Chart via Bitstamp on September 12th.
Looking at the 4-hour chart for Bitcoin reveals that the uptrend initiated on September 7 from approximately $110021 remains intact. Rising swing lows are approaching a resistance level near $116358. While momentum appears positive with impulsive candles forming frequently; nearby ceilings have repeatedly rejected advances. If Bitcoin manages to break through this barrier at around $116358 it could target the next key level at approximately \$118000; however if momentum falters again historically favorable entry points have been noted during retracements into \$113500 – \$114000 where previous demand was evident and risk can be more easily managed.
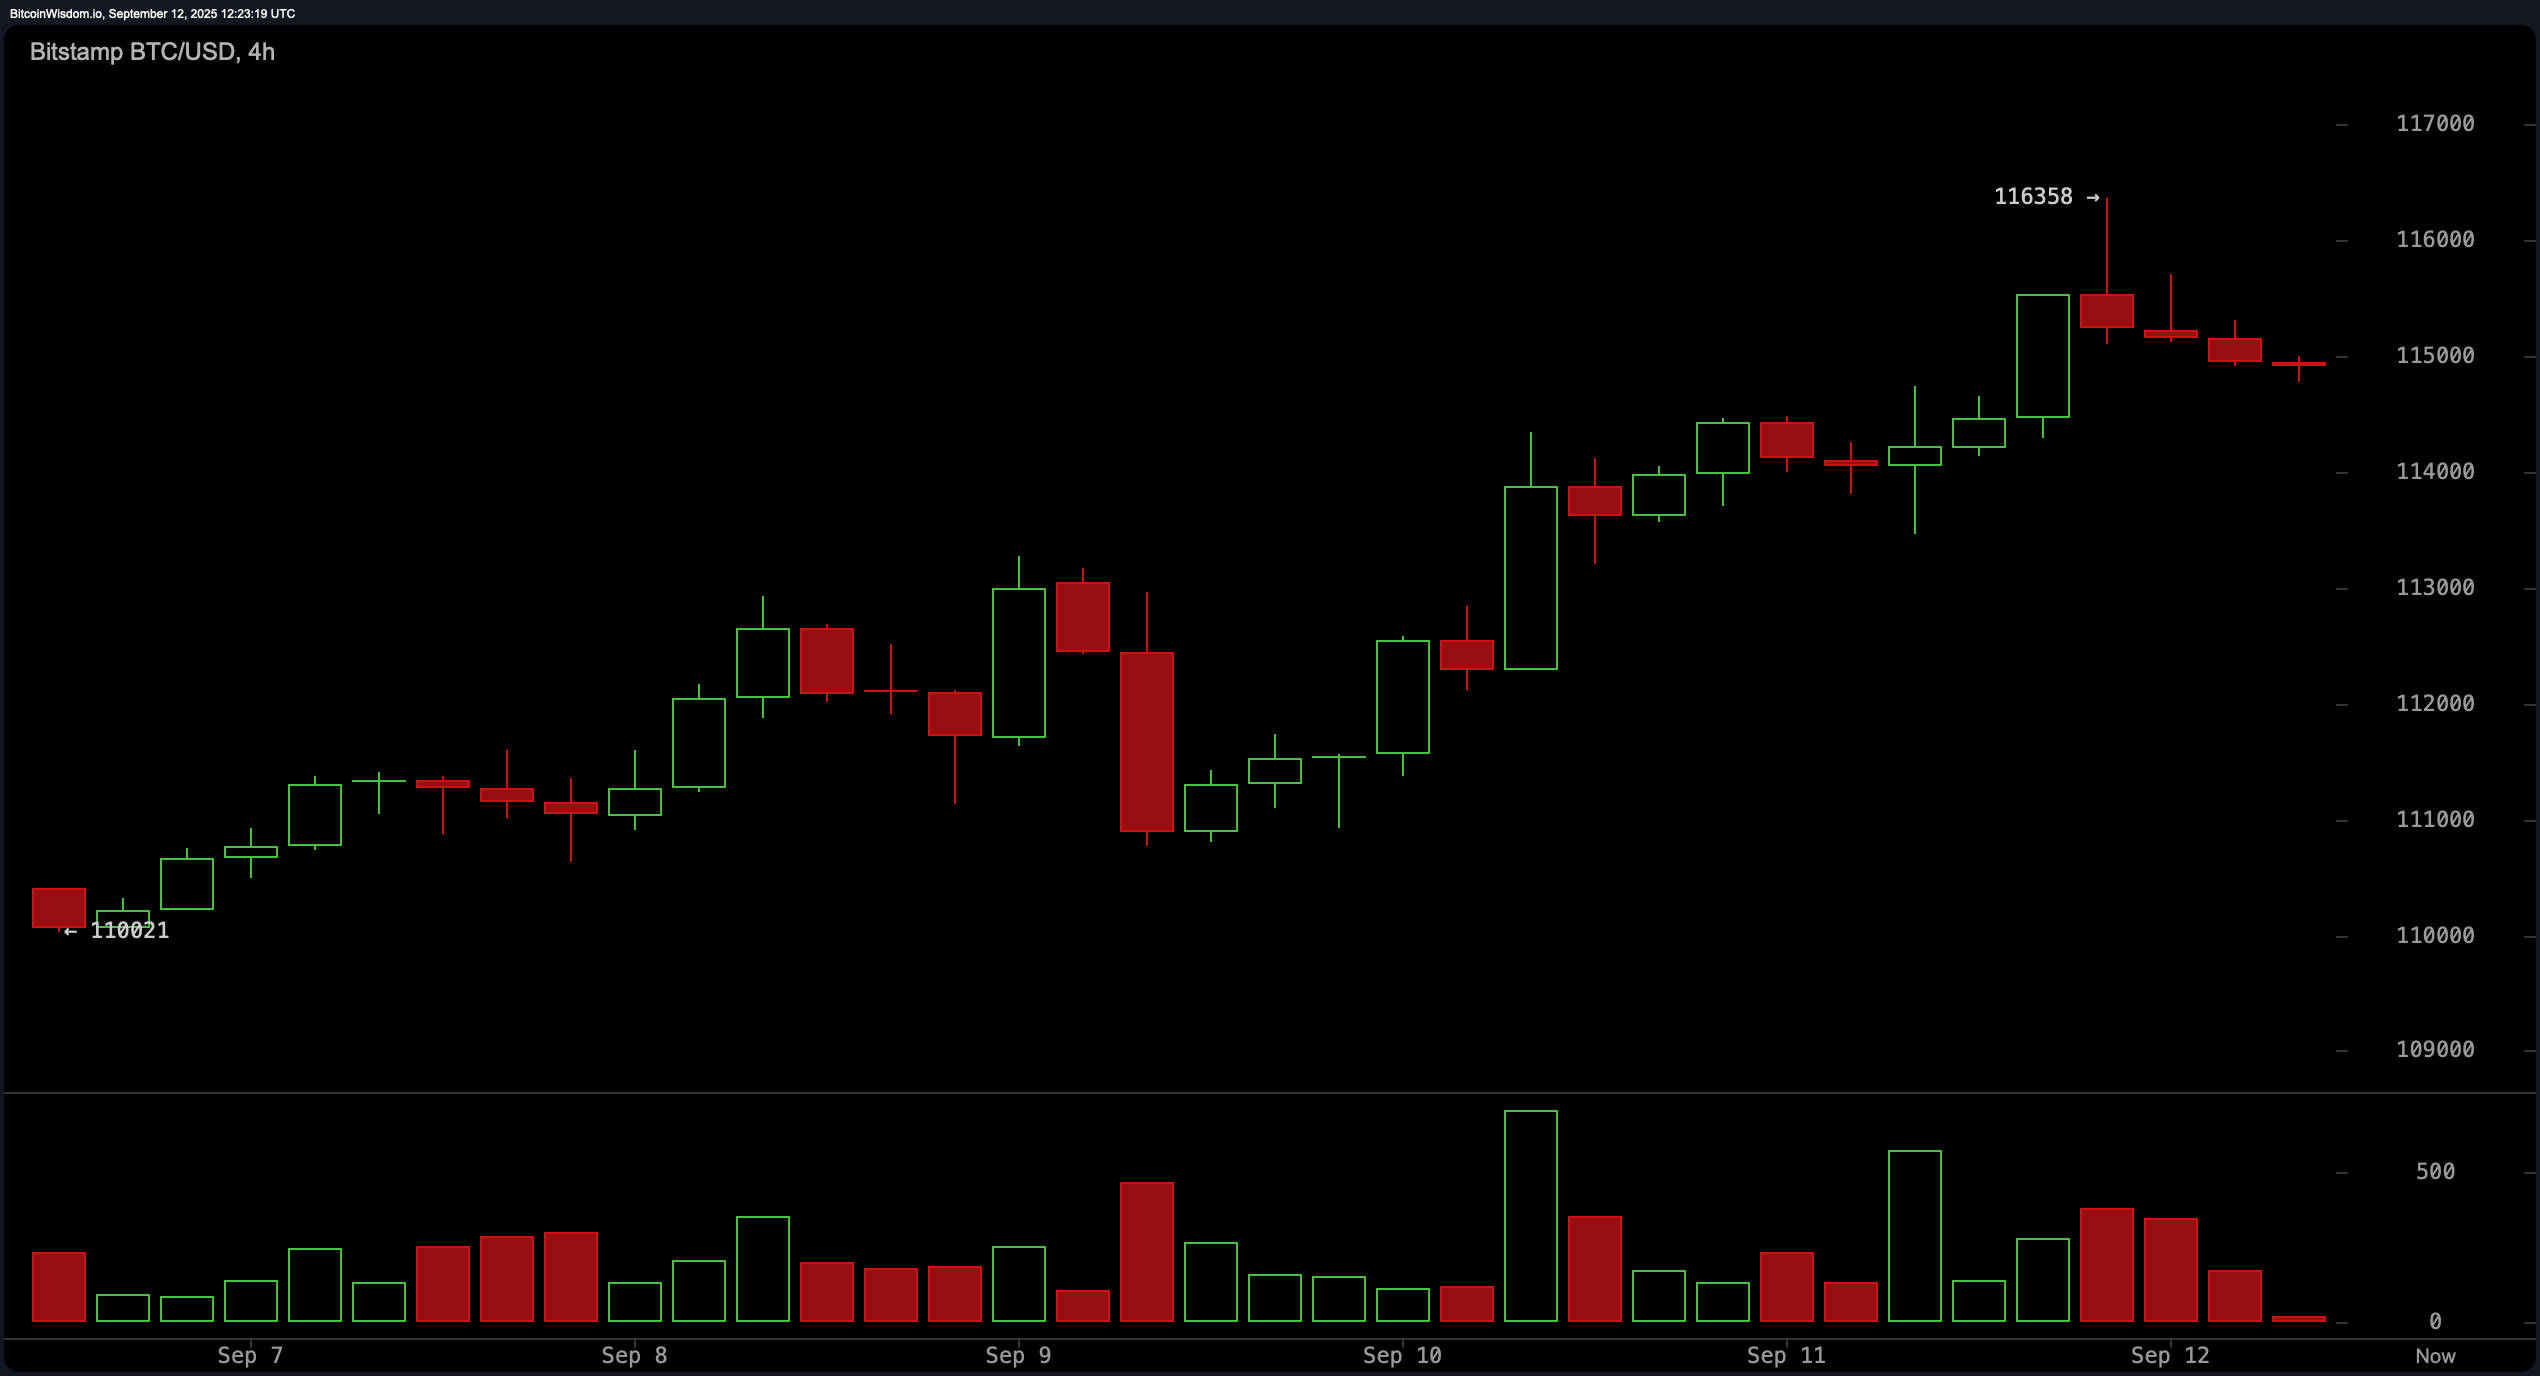
BTC/USD 4-Hour Chart via Bitstamp on September 12th.
The hourly analysis indicates a clear breakout from around \$113460 per bitcoin followed by minor counter-trend movements marked by lower highs as volume decreased. For those trading intraday shifts watching closely within the range of \$114500 -\$115000 will be crucial as potential reversal signals may emerge here along with renewed activity levels should they arise again soon after stalling below ranges of about \\\$116300-\\\$116500 trimming exposure within these limits would seem wise until broader market engagement resumes enough clarity emerges regarding directionality.
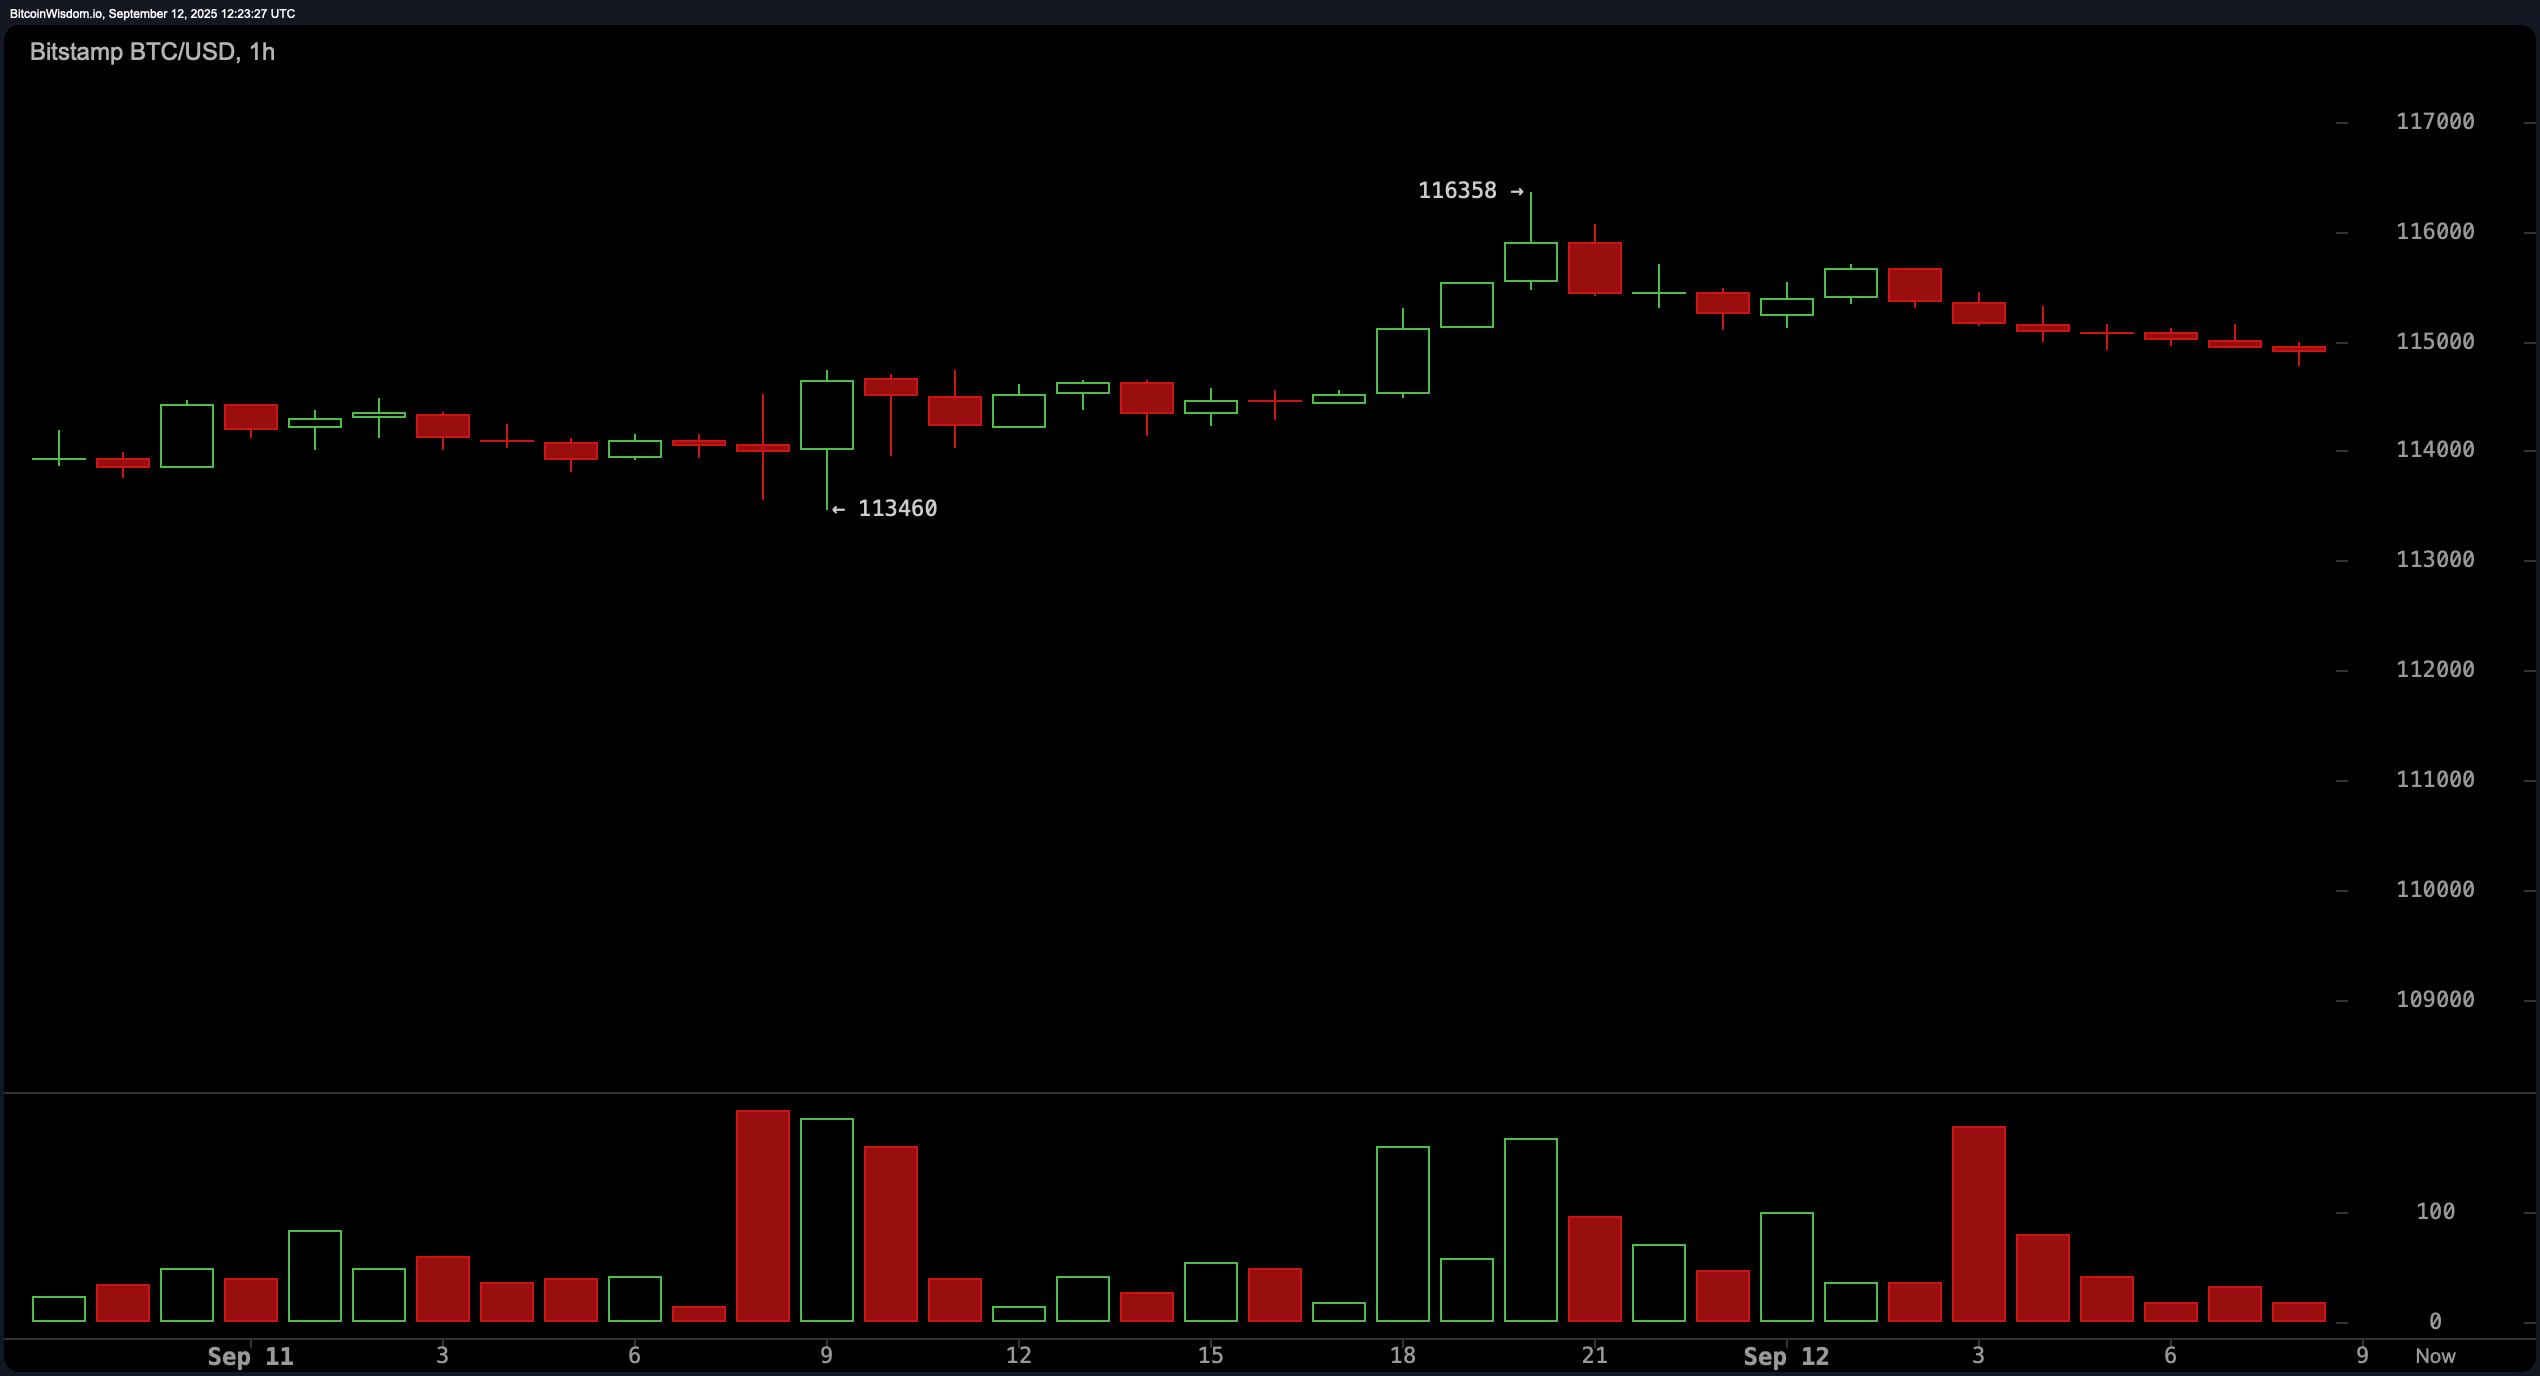
BTC/USD Hourly Chart via Bitstamp on September 12th.
The oscillators present mixed signals but lean slightly positive overall: The relative strength index (RSI) sits at neutral territory with readings showing values such as Stochastic oscillator (Stoch) hitting neutral marks too while commodity channel index (CCI) reads high indicating possible overextension thus caution advised alongside average directional index (ADX) reflecting neutrality overall trends currently seen reflected through Awesome oscillator(AO), negative MOM metrics suggest bearish tendencies but MACD remains bullish indicating potential upside still exists provided supportive conditions persist without breaking critical thresholds outlined earlier herein thus favoring cautious optimism rather than outright aggressive positioning until confirmed signs materialize appropriately across various timeframes monitored closely moving forward into upcoming sessions ahead!
Trend indicators show an upward bias across multiple time frames examined thoroughly here today! Notably exponential moving averages(EMA): EMA10 shows value near \\$112826 signaling bullish sentiment likewise simple moving averages(SMA): SMA10 reflects similar positivity resting comfortably around \\$112252 respectively—this pattern continues downwards through EMA20/SMA20 & EMA30/SMA30 maintaining constructive outlooks reinforcing bullish structures observed lately since mid-$113k zones hold firm supporting current market dynamics while looking ahead towards pivotal inflection points located nearer toward threshold areas identified previously mentioned above!
Bullish Outlook:
If Bitcoin maintains its position above mid-$113k whilst successfully reclaiming both thresholds set forth earlier ($116358 followed closely thereafter by reaching upwards past those barriers nearing ~$118K), then prevailing trends indicate continued advancement potentially targeting ranges extending all-the-way-upward toward lofty aspirations aiming closer-towards figures hovering somewhere in vicinity surrounding either~120K-124K regions! Confirmation shall come when hourly or four-hour closing prices exceed levels stated before coupled together witnessing increased volumes backing such moves made—risk parameters shift significantly downward should prices fall below \(14K intraday basis along any daily closures dipping under \(13\,5)\$ thresholds indicated herein prior!
Bearish Outlook:
If price action keeps stalling beneath critical resistances found situated right around boundaries set forth earlier (~\(16\,300-\(16\,500)) whilst concurrently rolling back down through lower supports encountered amidst ranges falling between (\(14\,50-\(13\,50)), then combination factors involving mid-range RSI readings alongside negative AO scores suggest heightened chances shifting downward trajectories aiming potentially reaching targets nearer proximity towards \(11\,200\sim~\(11000)! Confirmations needed arrive upon closure rates dipping below specified margins cited prior whilst turnover increases thereby solidifying bearish perspectives held onto firmly unless otherwise invalidated following sustained acceptance crossing back over aforementioned heights touched upon just moments ago leading us onwards positively instead!