
As the first week of March draws to a close, Bitcoin is facing significant selling pressure, prompting traders to brace for a possible revisit of the critical $60,000 threshold. After several failed attempts to maintain levels above $70,000, the charts are increasingly reflecting a prevailing bearish sentiment.
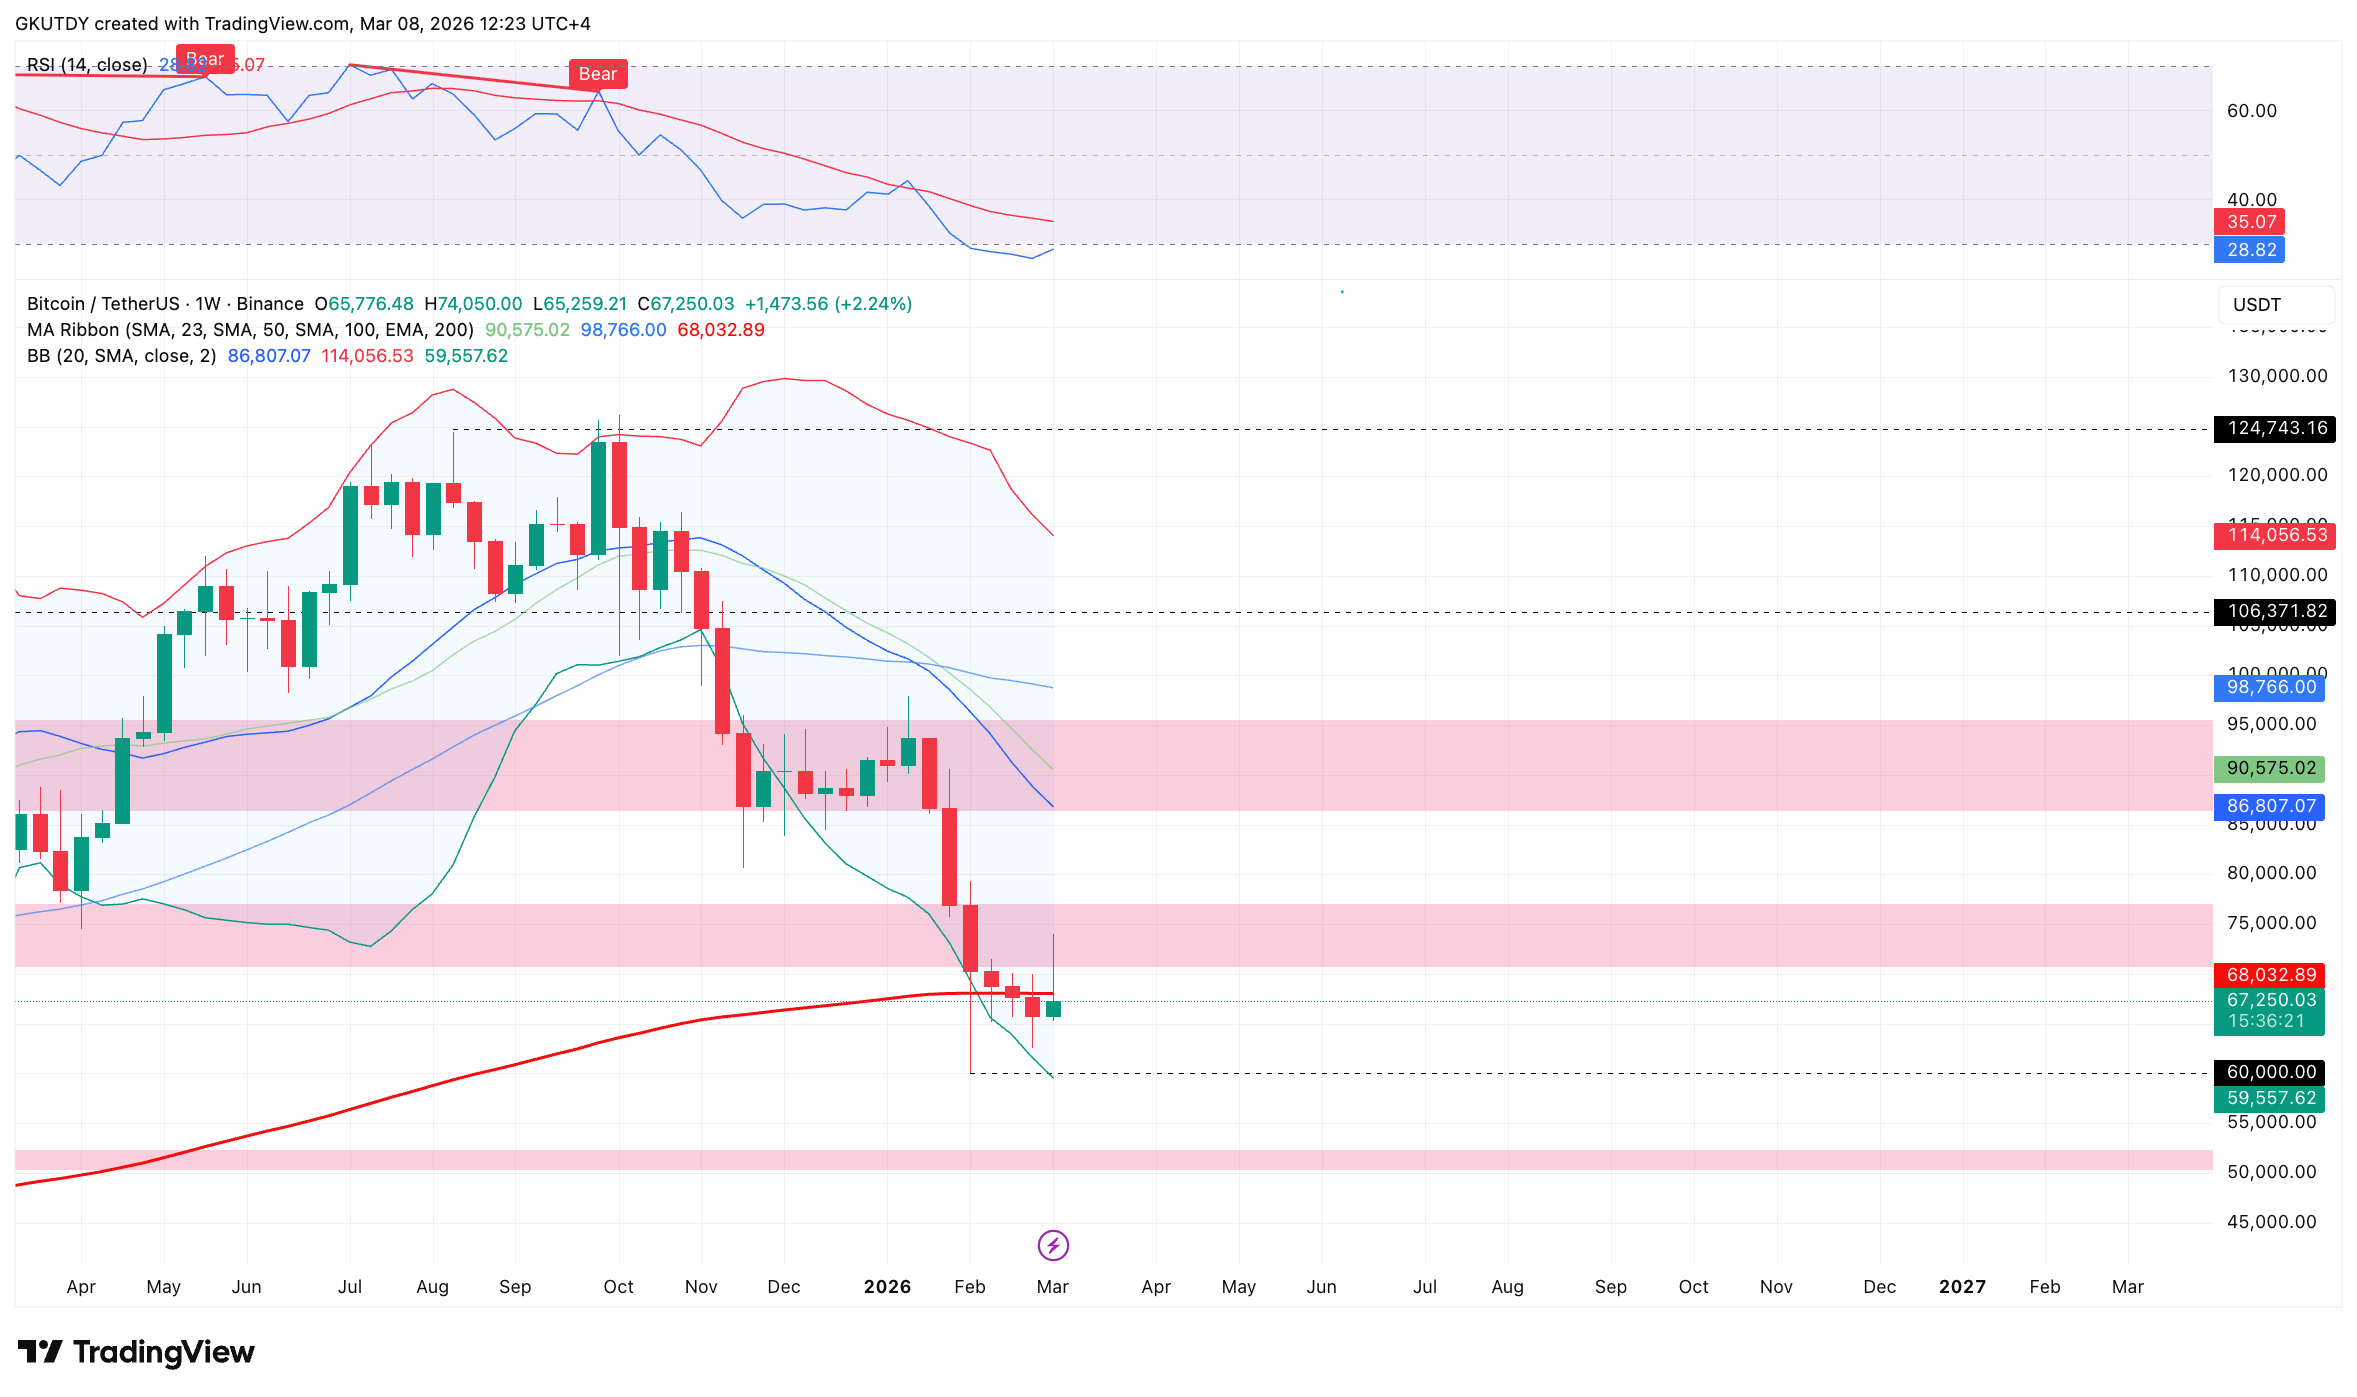
The current weekly chart for $BTC/USDT on TradingView reveals a clear descending channel formation. A pivotal negative development occurred when the price broke below the $68,000 zone—previously regarded as local support for buyers—which has now transformed into resistance that hampers any attempts at recovery.
Reasons Bitcoin Might Drop Below $60,000
There are three primary factors indicating that falling below $60,000 is more likely than ever:
- The price of $BTC has dipped below its 200-day moving average—a classic indicator suggesting that medium-term trends are currently bearish.
- The Relative Strength Index (RSI) is situated in bearish territory at under 40 points. This indicates that buyer momentum has waned and there remains potential for further declines.
- Large-scale Bitcoin investors appear focused on accumulating within the range of $52,000 to $55,000. Markets often gravitate towards these zones to gather liquidity before initiating new growth phases.
If this week concludes with prices beneath $65,000—where the 200-day moving average resides—the likelihood of a swift decline toward or even below $60,000 will become increasingly probable.
The current analysis suggests we have not yet reached the bottom of this local correction. Maintaining support at around $60,000 could serve as a foundation for potential rebounds; however breaking through this level would pave the way for an extended downward correction.