
The latest on-chain metrics in the cryptocurrency sector are providing significant insights into investor behavior and market sentiment. Notably, both derivative data and on-chain indicators reveal an intriguing scenario for Bitcoin.
Recent statistics from the past day show that while Bitcoin’s price hovered around $72,280, liquidations in the market reached a staggering total of $327.18 million. Among these liquidations, long positions accounted for $237.64 million, whereas short positions contributed to $89.54 million. This data implies that approximately 72.6% of all liquidations were from long positions, indicating a substantial market correction following overly optimistic short-term expectations.
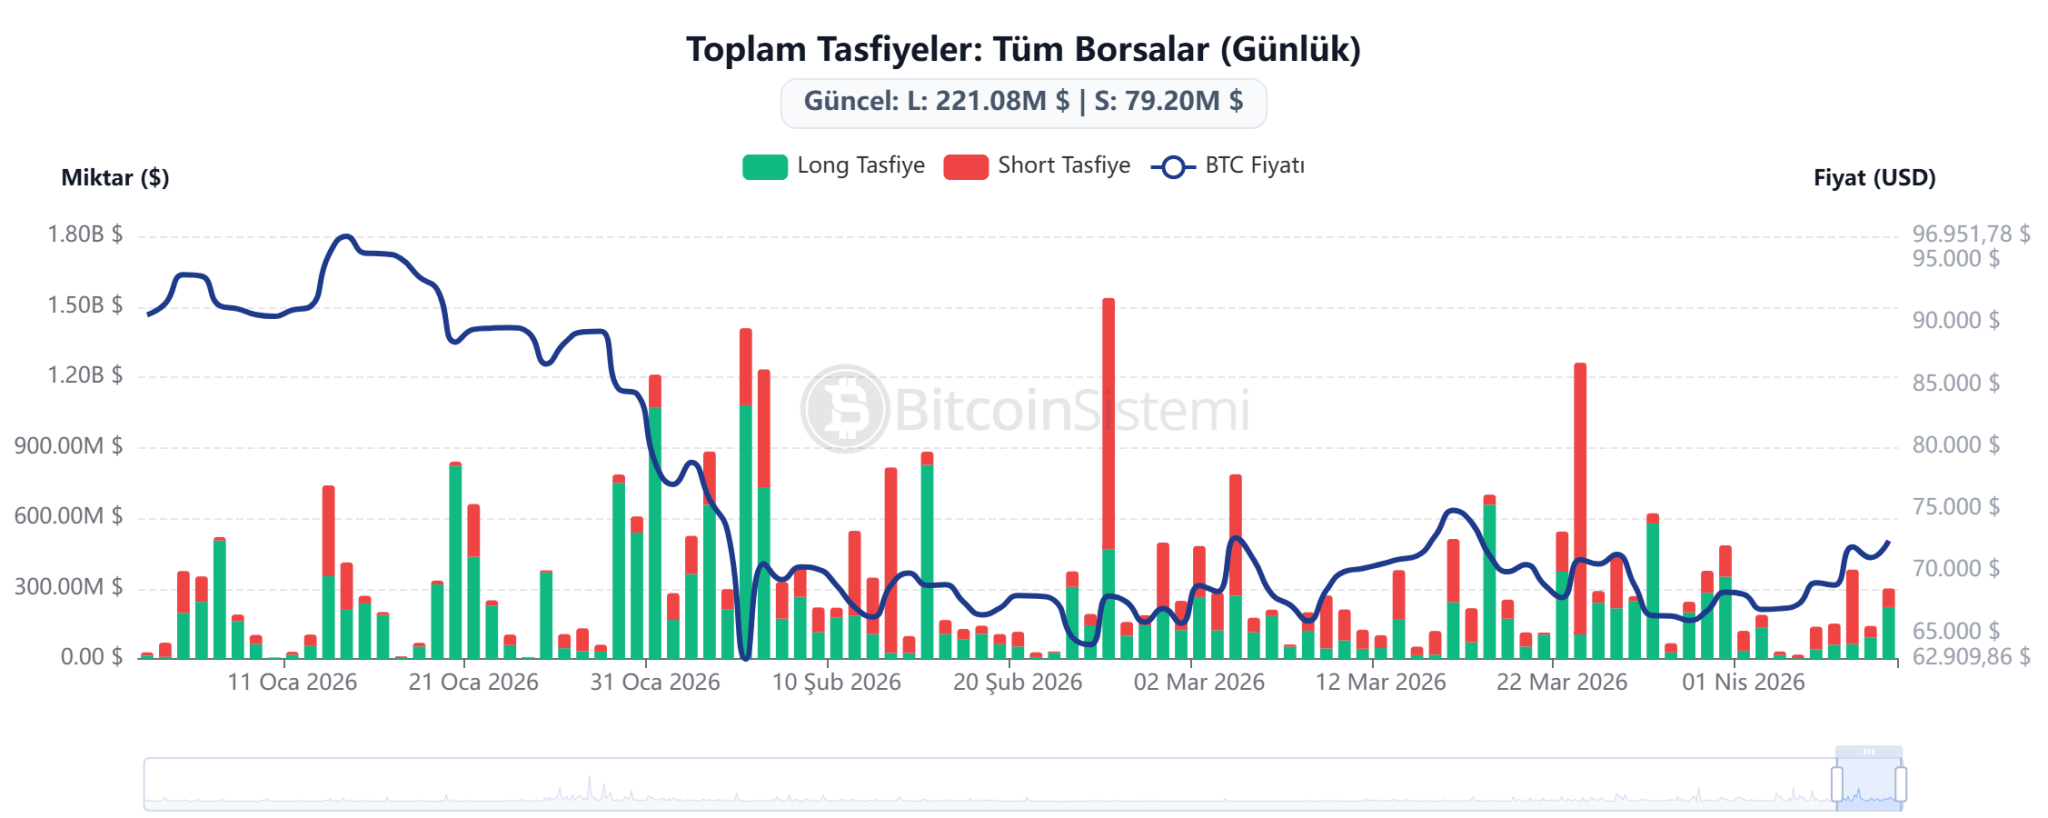
Conversely, the fear and greed index—an indicator of market sentiment—remains entrenched in the “Extreme Fear” territory with a current score of 14; this is down from yesterday’s score of 17 and last week’s figure of 12.
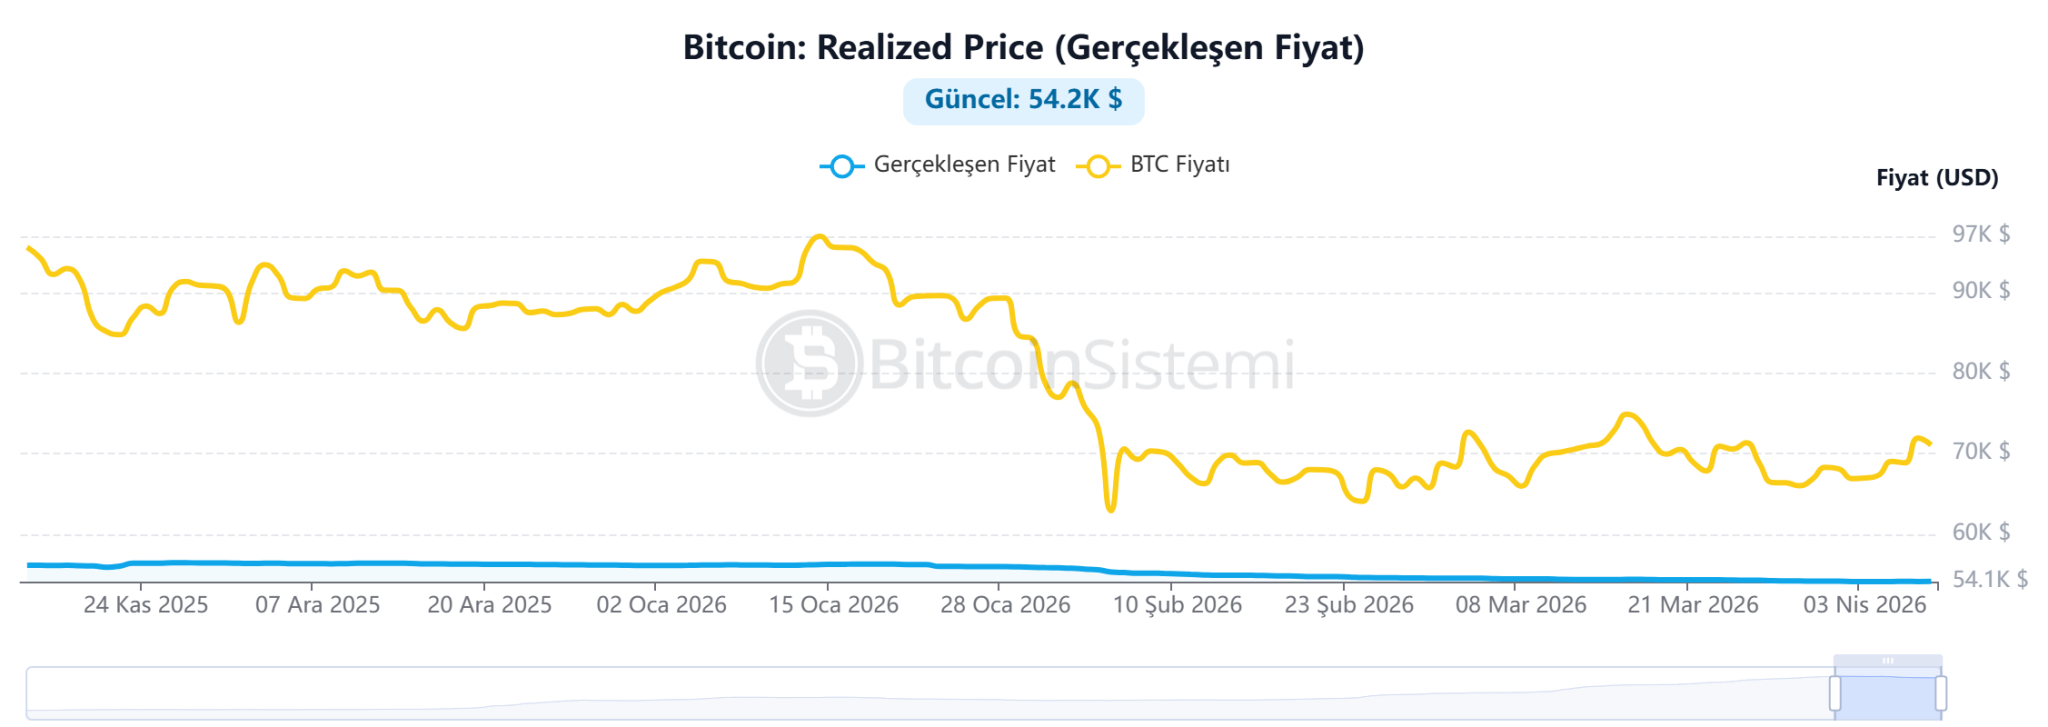
Another critical metric worth noting is Bitcoin’s “actual price,” which stands at approximately $54,200. The fact that current prices are significantly above this threshold suggests overall profitability within the market; thus, this level may serve as robust support during upward trends. Historically speaking, when prices approach this mark in previous cycles, it has often signaled diminishing selling pressure alongside increased buying activity.
Related News One Close Associate to Satoshi Nakamoto States: “Adam Back Is Not Satoshi”
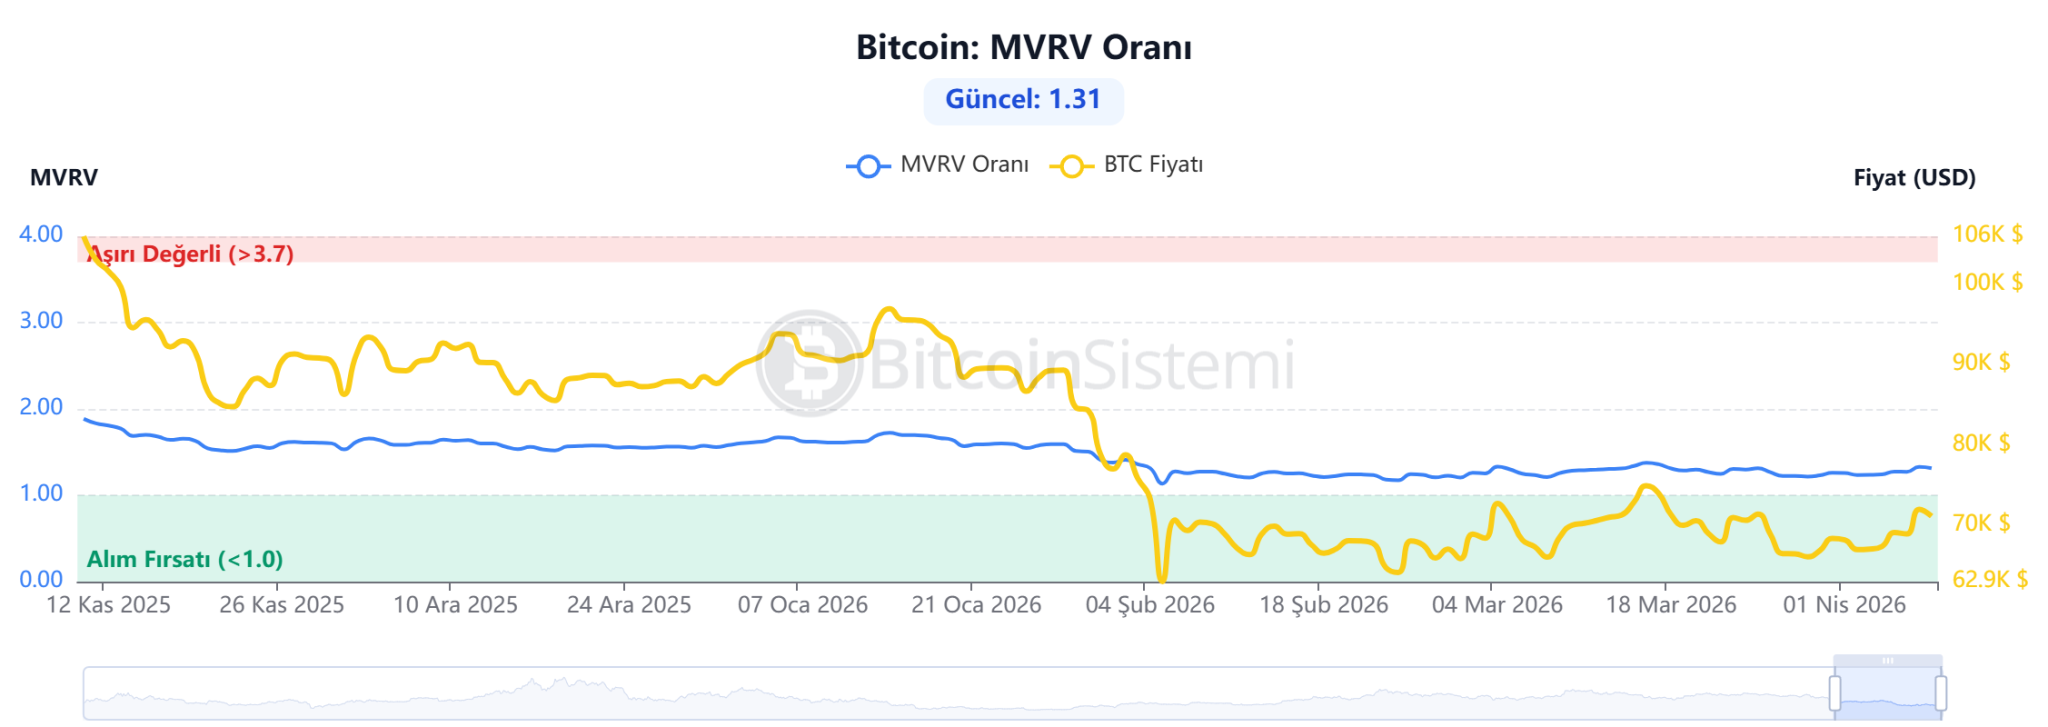
The MVRV ratio currently sits at 1.31—a figure suggesting that the market is neither overly cheap nor excessively expensive but rather near equilibrium with slight profit-taking tendencies observed among investors. Traditionally speaking, an MVRV below 1 indicates potential bottoming out conditions while values exceeding 3.7 signal bubble risks or peak warnings for investors’ attention.
*This information should not be construed as investment advice.