The Bitcoin price remains steady above the $62,200 support level, forming a notable double bottom reversal pattern.
Historical data from previous cycles indicates that bear markets typically span approximately 21 to 23 months from peak to trough.
A bullish divergence observed in the daily Relative Strength Index (RSI) at 43% hints at a possible near-term recovery.
On Wednesday, Bitcoin saw a robust influx of buying activity that propelled its price up to around $69,000, marking an intraday increase of 7.7%. This surge followed a shift toward risk-on sentiment across broader markets after President Trump’s State of the Union address on February 24. Although this relief rally requires further confirmation before signaling a full trend reversal, on-chain metrics suggest additional challenges ahead before buyers can firmly establish support at the bottom.
Market Bottoms Align with Approximately 23 Months Since All-Time High
Over the past five months, Bitcoin’s value has declined sharply from $126,272 down to about $69,533—a drop of roughly 45%. Concurrently, its market capitalization contracted significantly to around $1.37 trillion.
An analysis based on monthly charts highlights recurring patterns where declines from peak prices tend to last between 21 and 23 months before hitting cycle lows. Currently sitting near this timeframe since its last all-time high—about 23 months—Bitcoin appears aligned with what trader Coinvo has identified as consistent cycle bottoms seen in previous bear phases without exception so far.
Technical indicators provide further insight into this correction phase. For instance, Bitcoin’s Sharpe ratio—which measures risk-adjusted returns—has recently plunged deep into negative territory with values dropping as low as -38 or approximately -11.6 according to analyses by platforms like Alphractal and others. Historically such depressed levels have emerged during late-stage bear markets when returns lag significantly behind volatility spikes.
Market analysts emphasize that despite timing aligning with historical precedents and strong downside risks evident through risk-reward metrics, uncertainty remains due to broader economic factors influencing price action currently.
Bitcoin Targets an Upside Move Toward $82,000 Backed by Double Bottom Formation
The past three weeks have seen Bitcoin trading within a range between roughly $73,000 and $62,200. Multiple oscillations inside this band indicate traders’ hesitation in committing strongly either upward or downward directionally.
Nevertheless, following renewed optimism across cryptocurrency markets, Bitcoin bounced off the key support level near $62,200 yesterday and is now trading close to $69K again. This rebound represents the second time it has reversed off that support during ongoing consolidation — forming what is classically known as a double bottom pattern.
This chart formation resembles a ‘W’ shape created by two distinct bullish swings off identical lows within this range. If confirmed, this setup suggests a potential rise of about 7.2%, targeting resistance near $73K—the neckline area for this pattern.
The momentum indicator RSI also shows higher lows corresponding with increased buying pressure at these bottoms, supporting prospects for an imminent breakout upwards.
A decisive move above the neckline resistance would likely accelerate bullish momentum considerably. Sustained demand could then drive prices toward approximately $81,530 following such breakout gains.
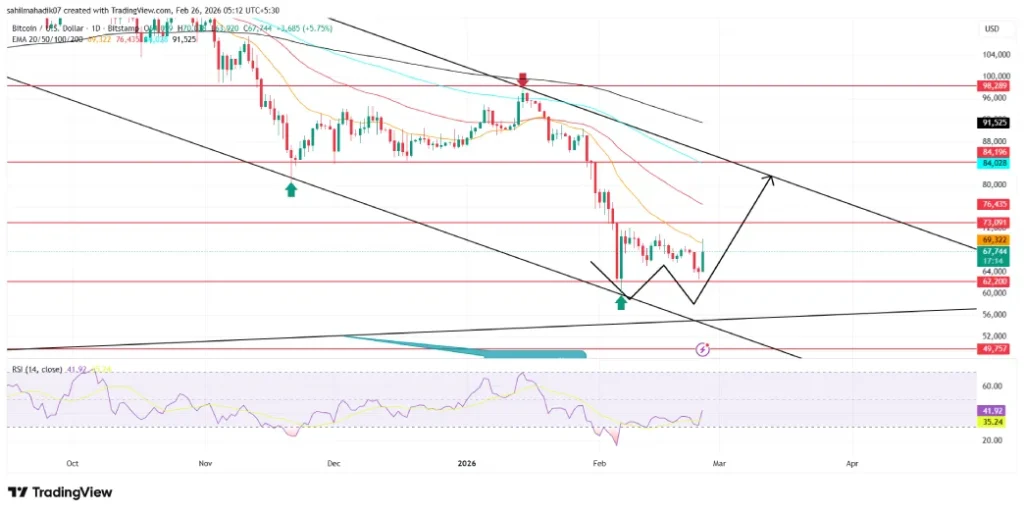
BTC/USDT – Daily Chart
If sellers manage to hold firm around the resistance zone near $73,000 however, the current sideways consolidation may extend further instead of breaking out immediately.