On March 22, 2026, Bitcoin was trading around $68,351, boasting a market capitalization close to $1.36 trillion and experiencing a 24-hour trading volume of approximately $20.6 billion. Throughout the day, its price fluctuated between $68,211 and $70,978. Although the overall technical stance appeared neutral at first glance, deeper analysis of indicators and moving averages suggested an underlying bearish pressure building up.
Bitcoin Market Analysis
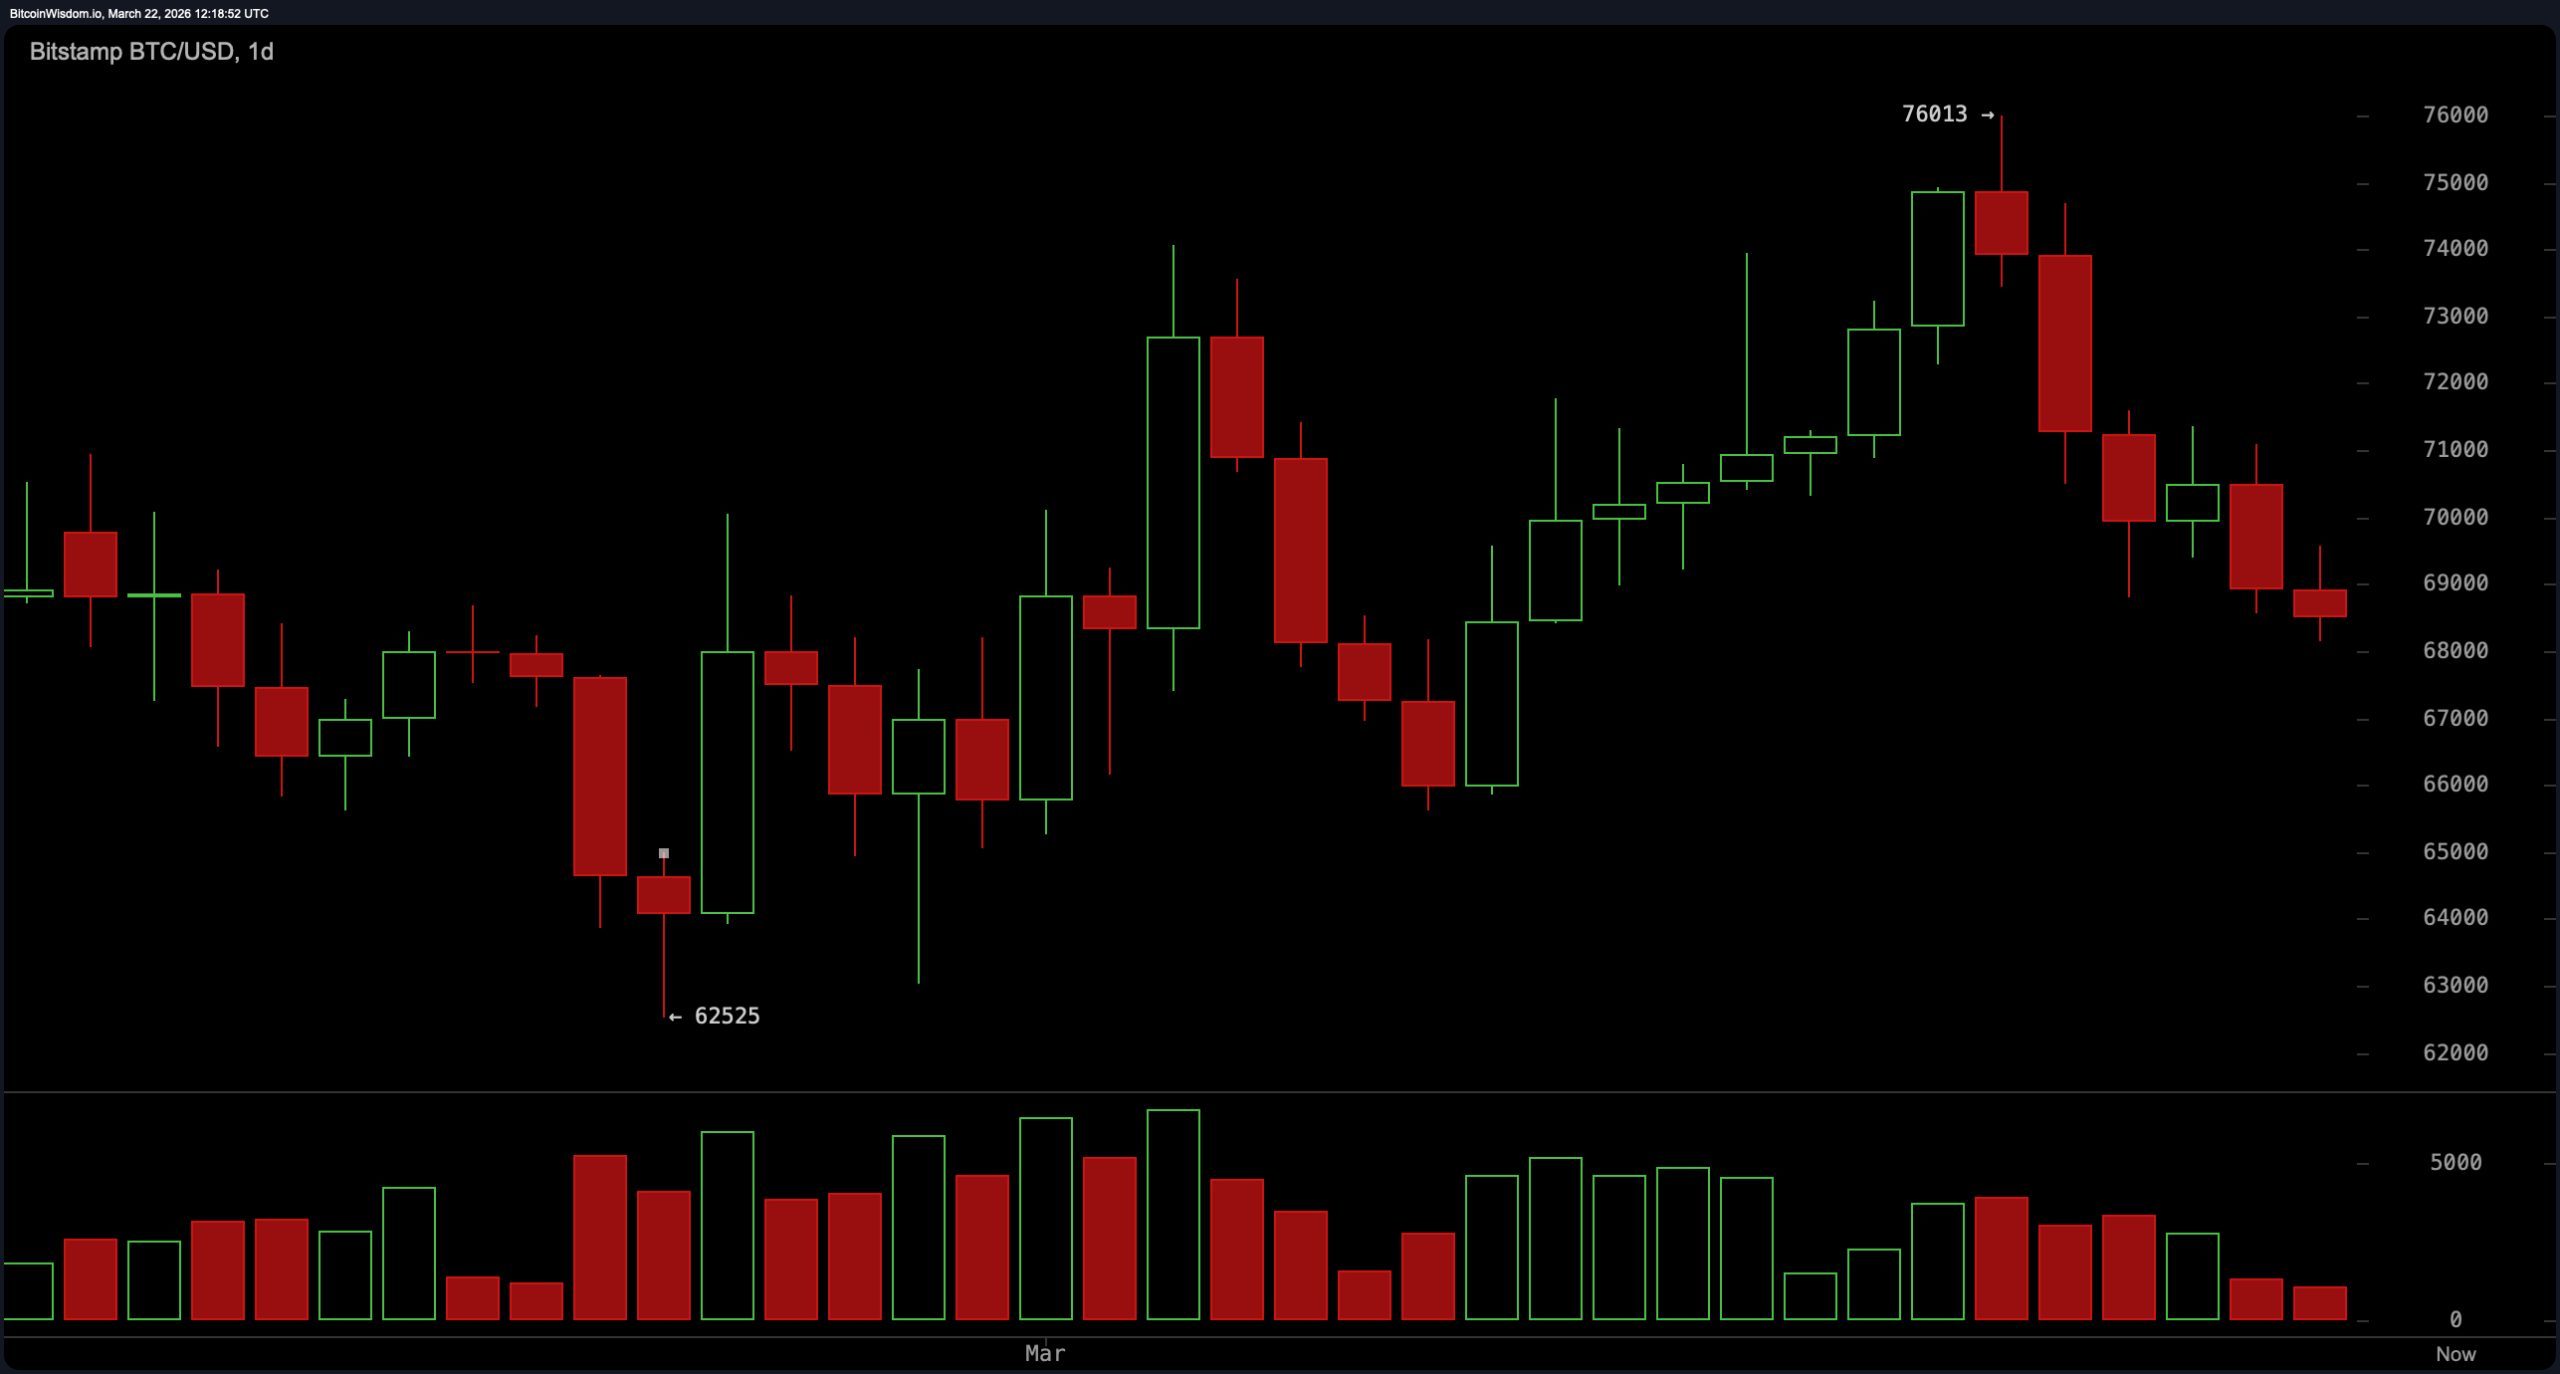
Following a decline triggered by renewed threats from U.S. President Trump towards Iran on Saturday night, Bitcoin managed to stabilize somewhat. The daily chart showed that after hitting an intraday peak near $70,978 and facing rejection there, the price settled into a consolidation zone just above the $68,200 mark. This narrow trading range indicated market indecision rather than clear directional momentum.
While no definitive breakdown occurred yet, Bitcoin’s failure to maintain higher levels pointed toward weakening bullish strength as volatility compressed between roughly $68,500 and $69,000.
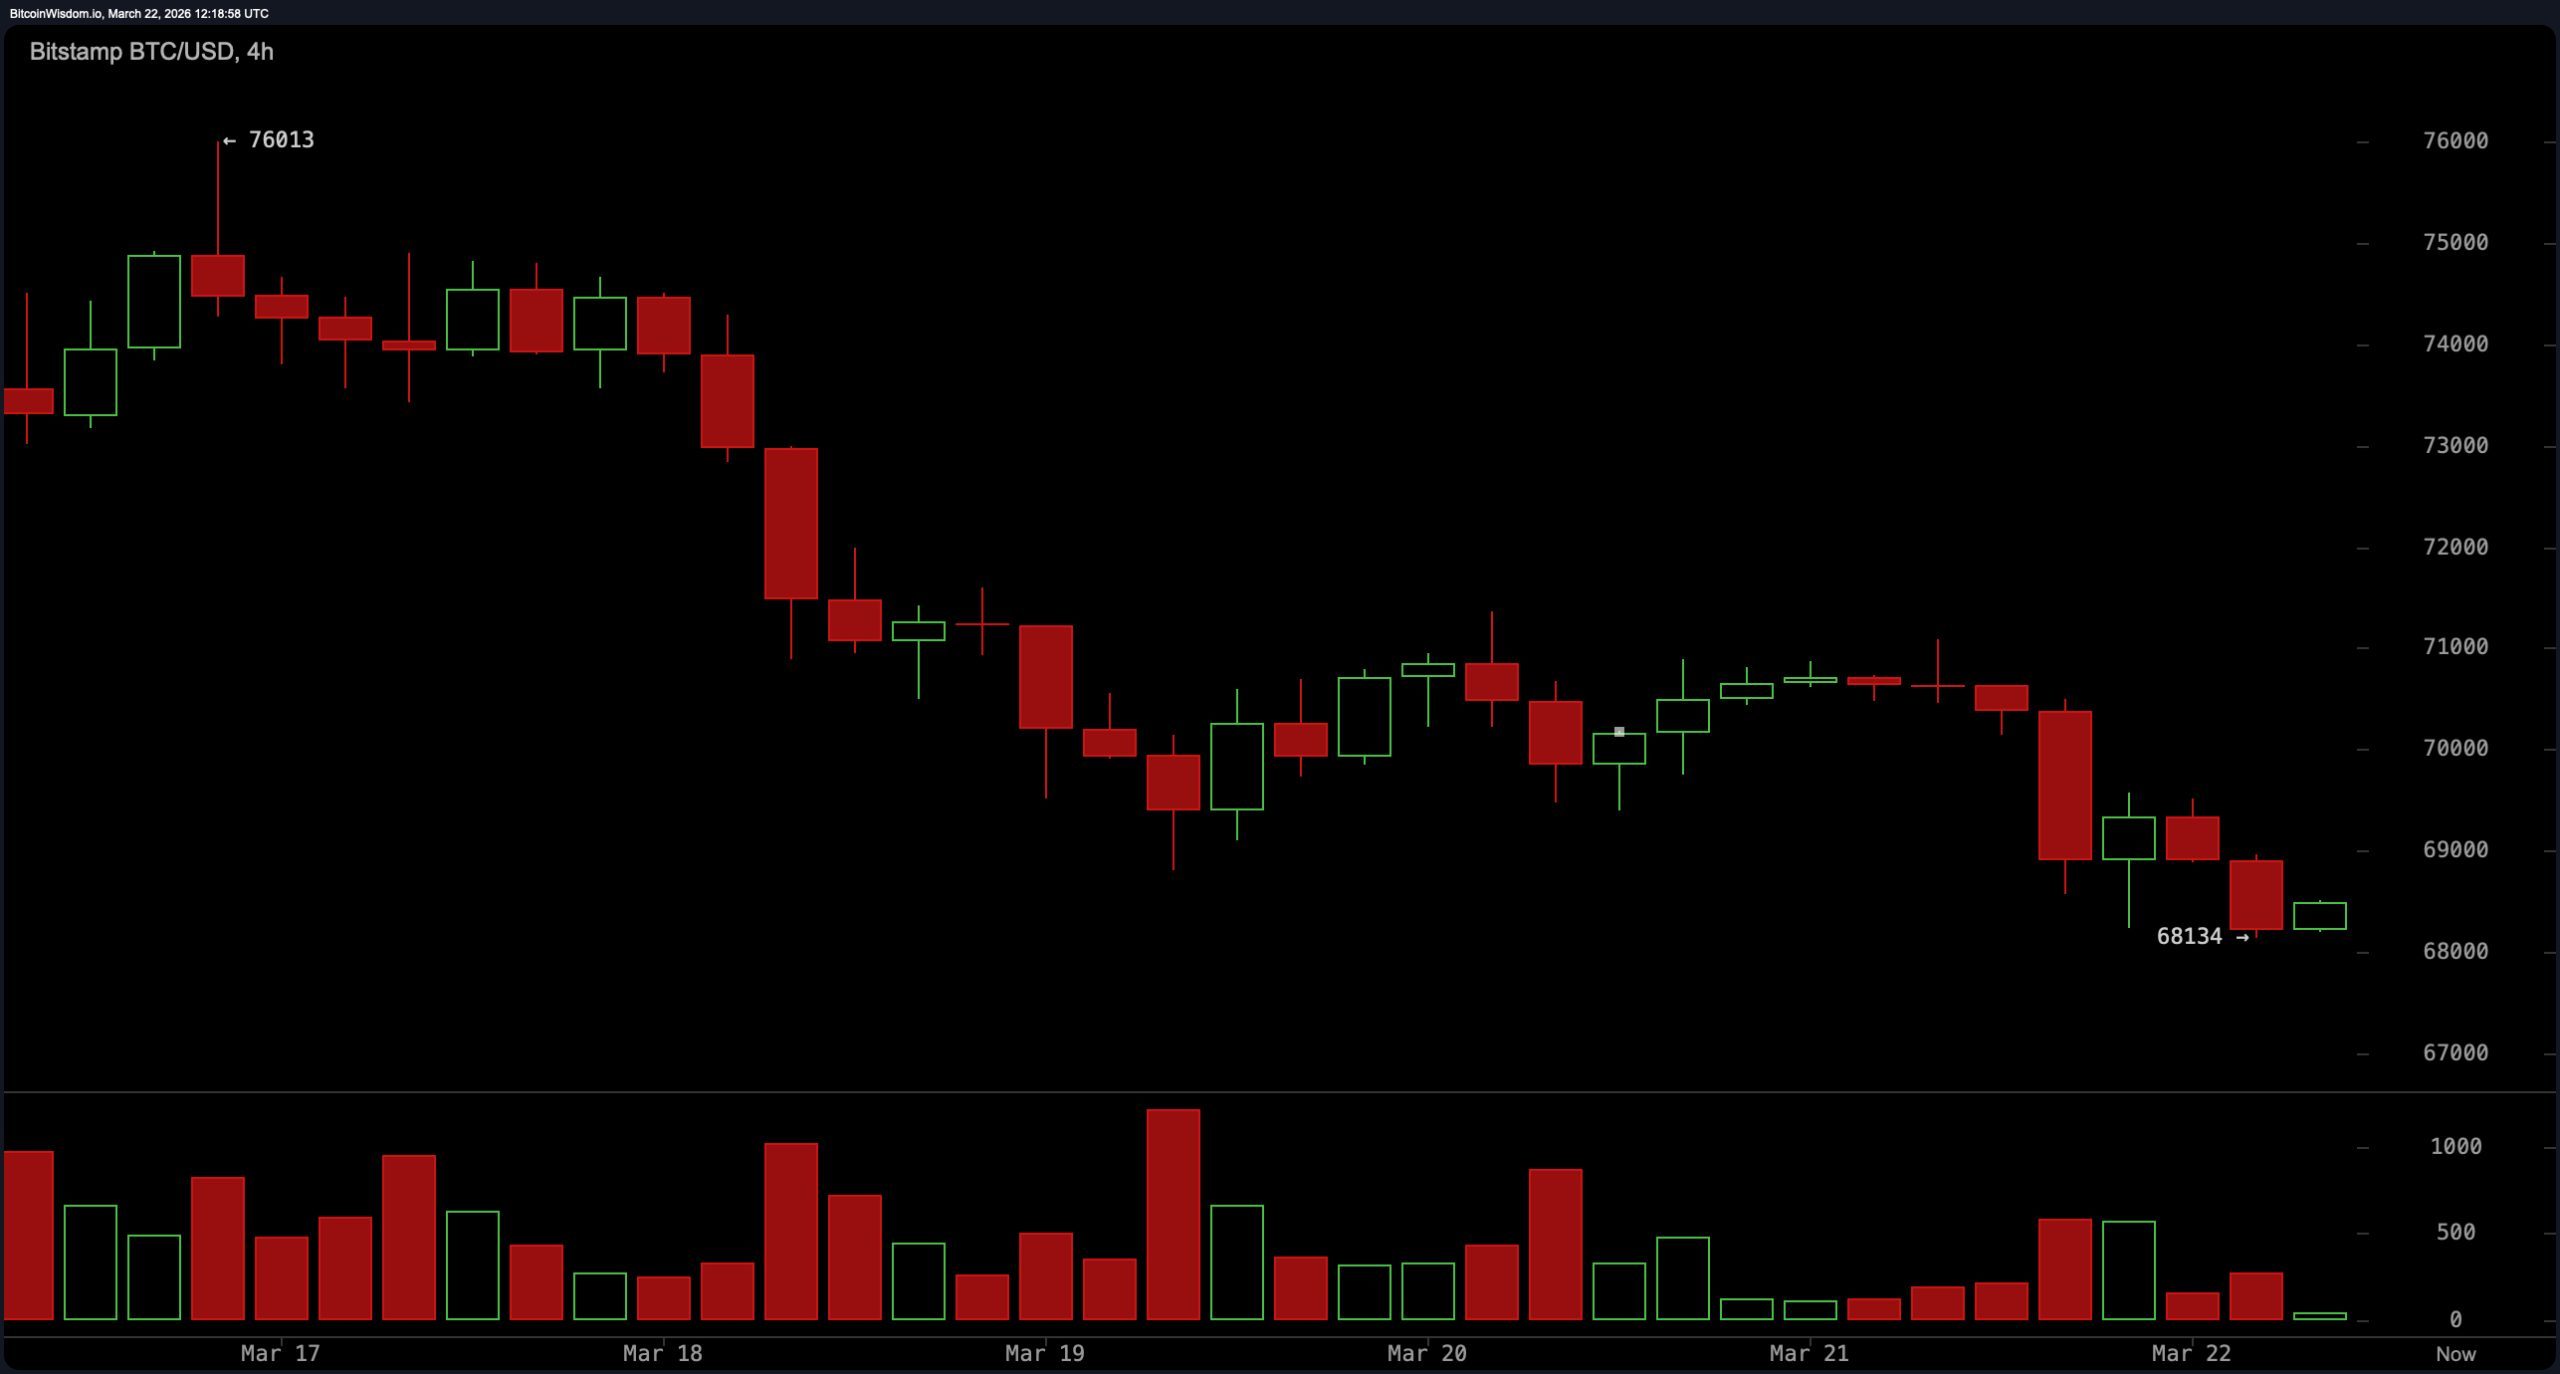
The four-hour timeframe painted a more cautious picture with prices forming lower highs while staying below short-term moving averages. This compression under resistance near the $69,500 level implied sellers were gradually gaining control despite no sharp drop occurring yet. The pattern suggested sentiment was shifting toward caution as rallies failed to gain traction amid persistent overhead selling pressure.
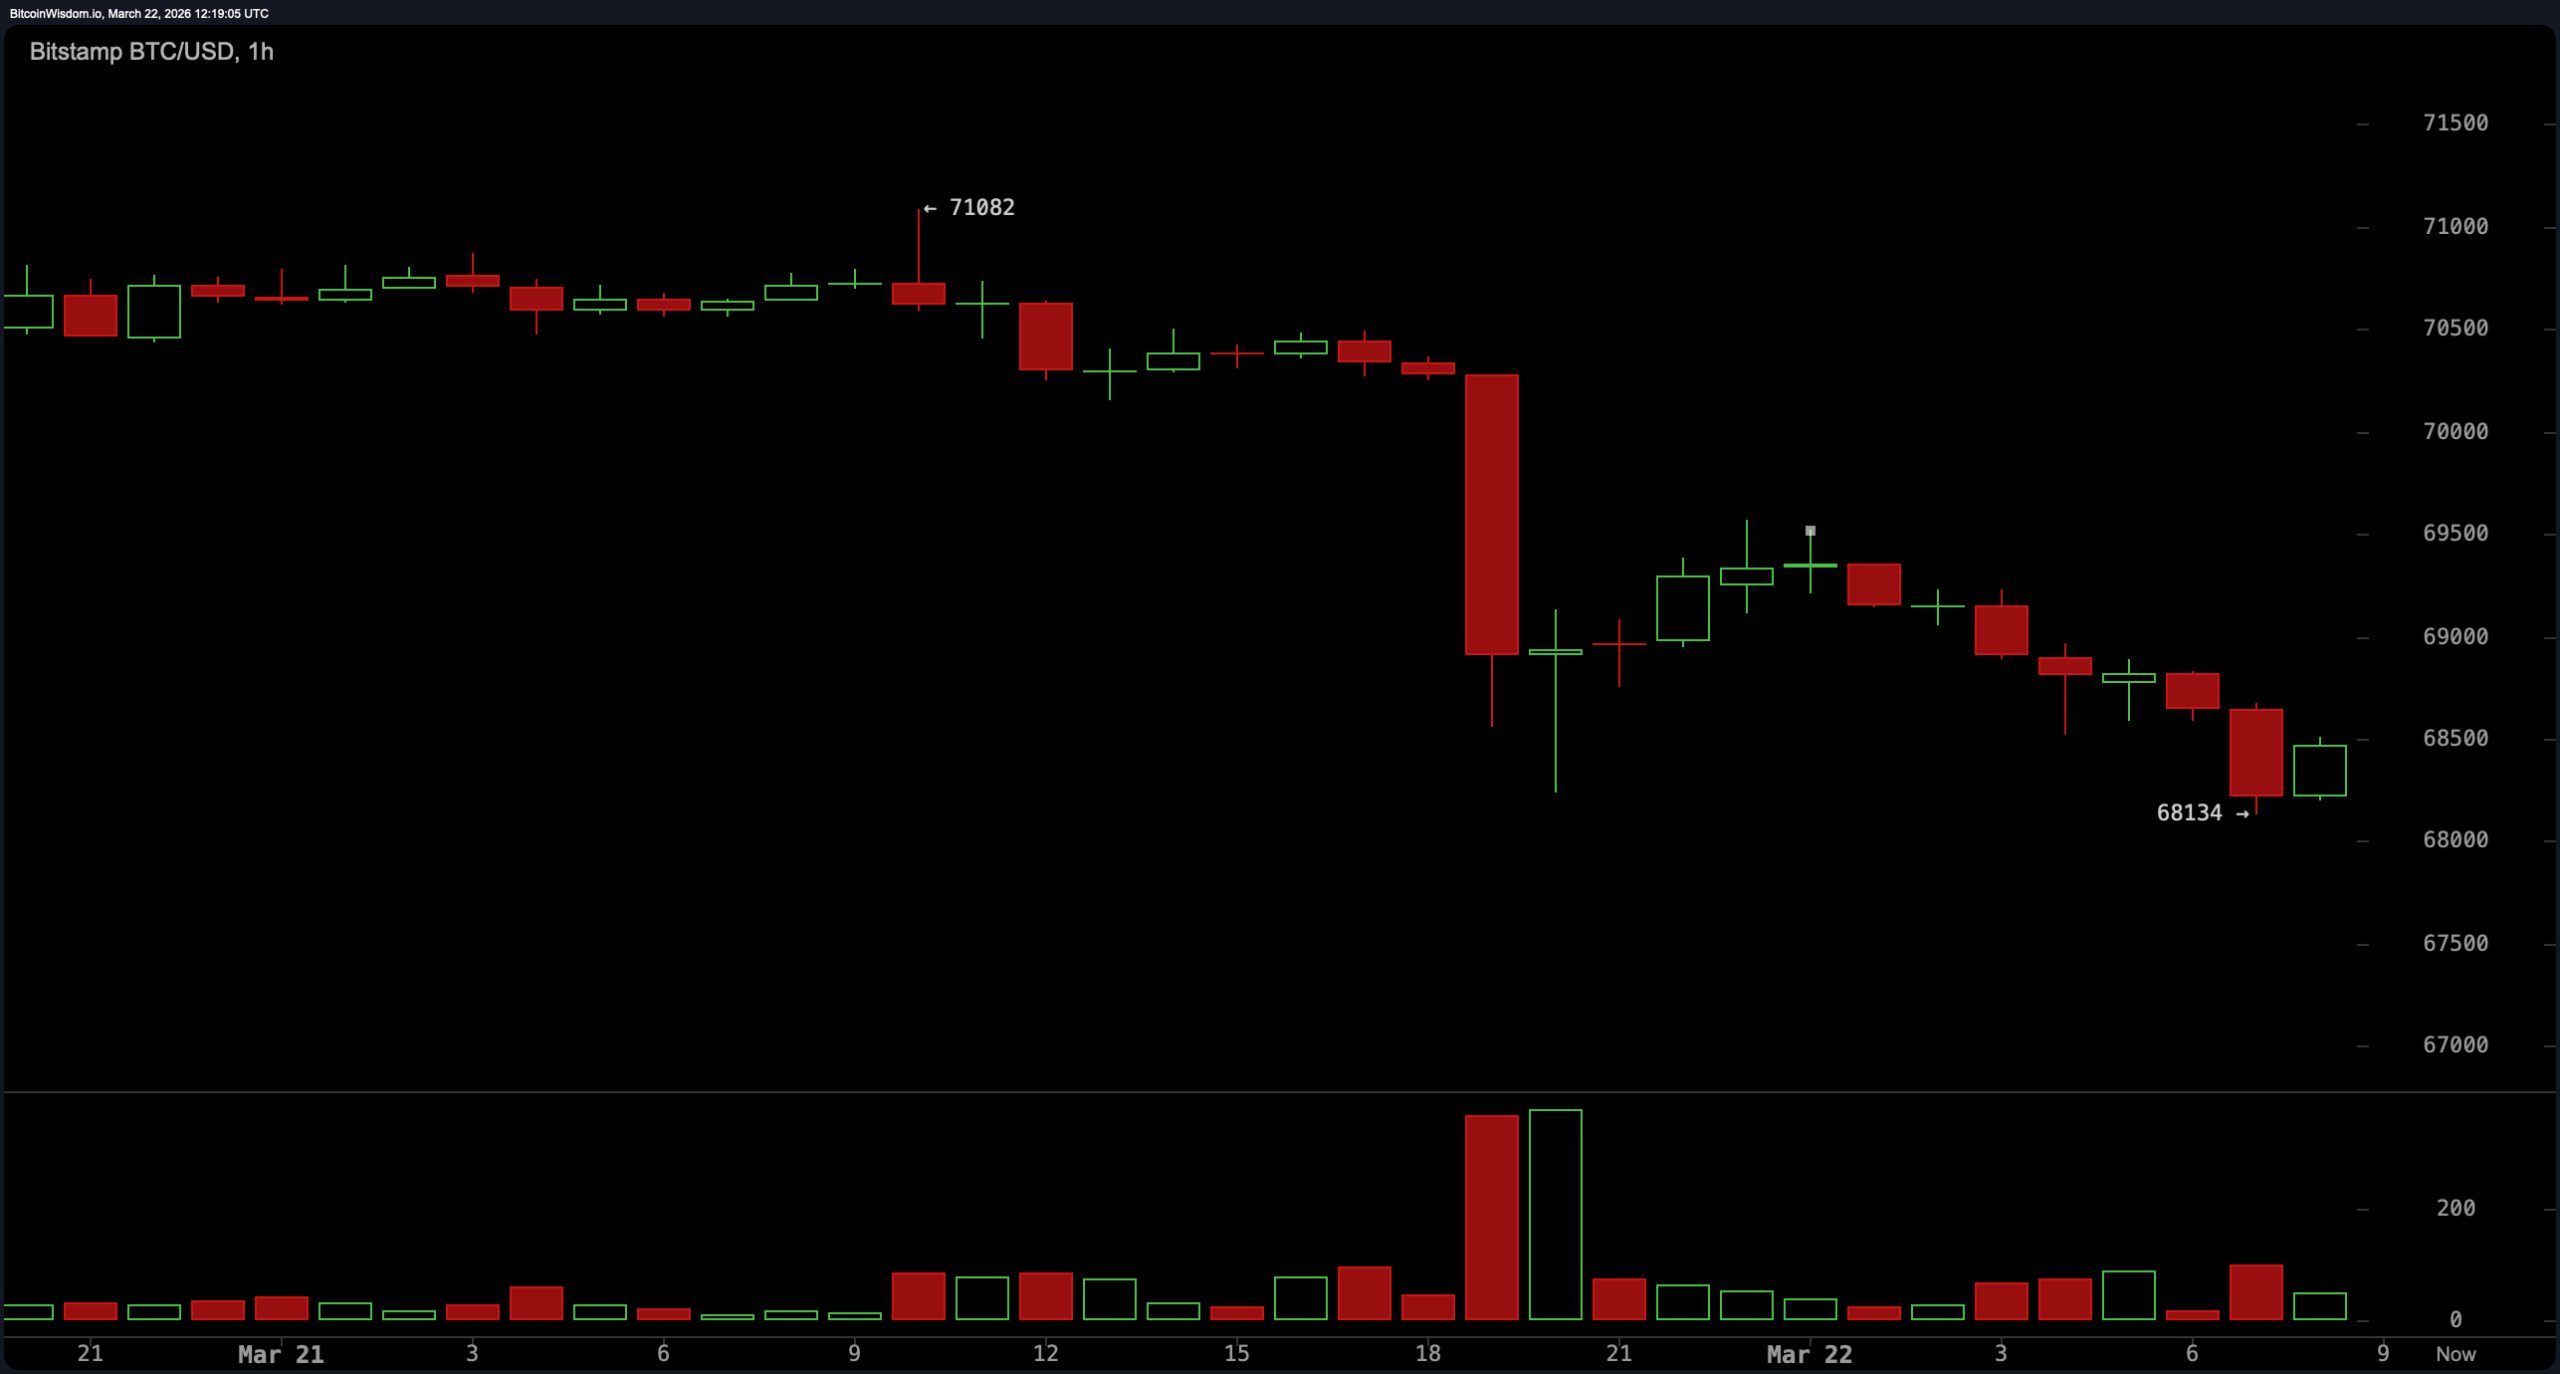
Zooming in further on the one-hour chart revealed sideways movement within a tight band around approximately $68,900 — signaling short-term equilibrium in play. Trade activity clustered narrowly between about $68,&925 and –$68,&&;959 demonstrated balanced order flow with neither buyers nor sellers showing urgency for breakout moves just yet.
The oscillators presented mostly neutral readings but contained subtle hints of caution: RSI hovered at 45 while stochastic oscillator sat near 35—both indicating lackluster trend strength.
The Commodity Channel Index (CCI) registered negative values around -68 whereas Average Directional Index (ADX) remained low at about 20 — all suggesting weak directional conviction among traders.
Despite this neutrality across many indicators, momentum dropped sharply into negative territory (-2067), accompanied by MACD levels at only +31—signaling latent bearish forces quietly mounting beneath surface calm.
A decisive signal came from moving averages which leaned heavily bearish: a majority—from short-term EMAs like the 10-day ($70,&–)313) through long-term SMAs such as the 200-day ($92,&–)573)—were positioned above current prices.
This alignment meant that out of fifteen key MAs tracked here thirteen exerted downward pressure on price action—highlighting structural resistance preventing any meaningful upward advance during this phase.
Bullish Perspective:
The support zone spanning roughly from &$68,&–)200 to &$68500 remains intact despite ongoing selling pressures overhead via moving averages—implying some residual demand persists beneath current levels.
If Bitcoin can break decisively above resistance ranging between &$69500–70000 coupled with improving momentum signals like rising RSI or MACD crossovers—it could reignite bullish trends indicating this period is merely consolidation before another upward leg rather than reversal.
Bearish Perspective:
The persistent cap imposed by multiple declining MAs combined with weak momentum metrics reinforces that bears still dominate sentiment near critical ceilings around &$70000.
A fall below key support close to &$68200 would likely accelerate downside moves confirming distribution phases masked as indecision rather than accumulation phases for future growth.
Frequently Asked Questions 🔎
- What is bitcoin&s price forecast for March twenty-second,; two thousand twenty-six??
Bitcoin exhibits mixed-to-cautious signals holding steady near sixty-eight thousand dollars underneath stiff resistance zones.;
– Why do bitcoin technicals suggest weakening conditions?nnMomentum indices including MACD show negative bias while other indicators remain flat implying diminishing buying power.;
– Which support or resistance points are crucial now?nSupport hovers closely around sixty-eight thousand two hundred dollars whereas heavy barriers lie within sixty-nine thousand five hundred up through seventy thousand range.;
– Are bitcoin&s moving average trends currently positive or negative?nMost significant MAs sit well above present pricing denoting prevailing downward force over intermediate horizons.;