Chart enthusiasts have a favored pattern known as the “golden cross,” and Bitcoin has just exhibited this signal, hinting at a potential rebound on the horizon.
However, the broader cryptocurrency market seems to be lagging behind this optimistic sign.
More than 95% of the top 100 cryptocurrencies by market capitalization experienced declines over the past day, dragging the total crypto market value down to $3.23 trillion. Even Bitcoin itself slipped about 1.3%, despite forming that bullish golden cross on its charts.
Meanwhile, traditional financial markets provided some relief. The S&P 500 rebounded Thursday after two consecutive losing days, buoyed by impressive earnings reports from Goldman Sachs and Morgan Stanley. Semiconductor stocks climbed following Taiwan Semiconductor’s stellar results. The Russell 2000 index reached a new all-time high, extending its winning streak against the S&P 500 to nine sessions—the longest since 1990—indicating that investors’ risk appetite remains intact.
Bitcoin’s Golden Cross: What Just Unfolded
A golden cross happens when a short-term moving average surpasses a longer-term one—commonly when Bitcoin’s 50-day moving average crosses above its 200-day counterpart—a classic indicator signaling rising momentum beyond prevailing trends.
Historically, Bitcoin has responded well to this pattern: in September 2023 it sparked a surge of approximately 148%, in September 2024 it gained around 64%, and between April and August of 2025 it rose roughly by one-third (35%). While history doesn’t guarantee future outcomes, these precedents often provide valuable insights.
The recent confirmation followed Bitcoin bouncing back from bearish pressure that pushed prices down from $125,000 to $80,000 last November. Currently, the shorter-term exponential moving average (EMA) sits just above its longer-term equivalent—a configuration widely regarded as bullish among technical analysts.
At present trading below $95,000 with a daily loss near -1.3% after reaching an intraday peak close to $97,200 earlier today; nonetheless Bitcoin is up about +5.4% over last week’s span.
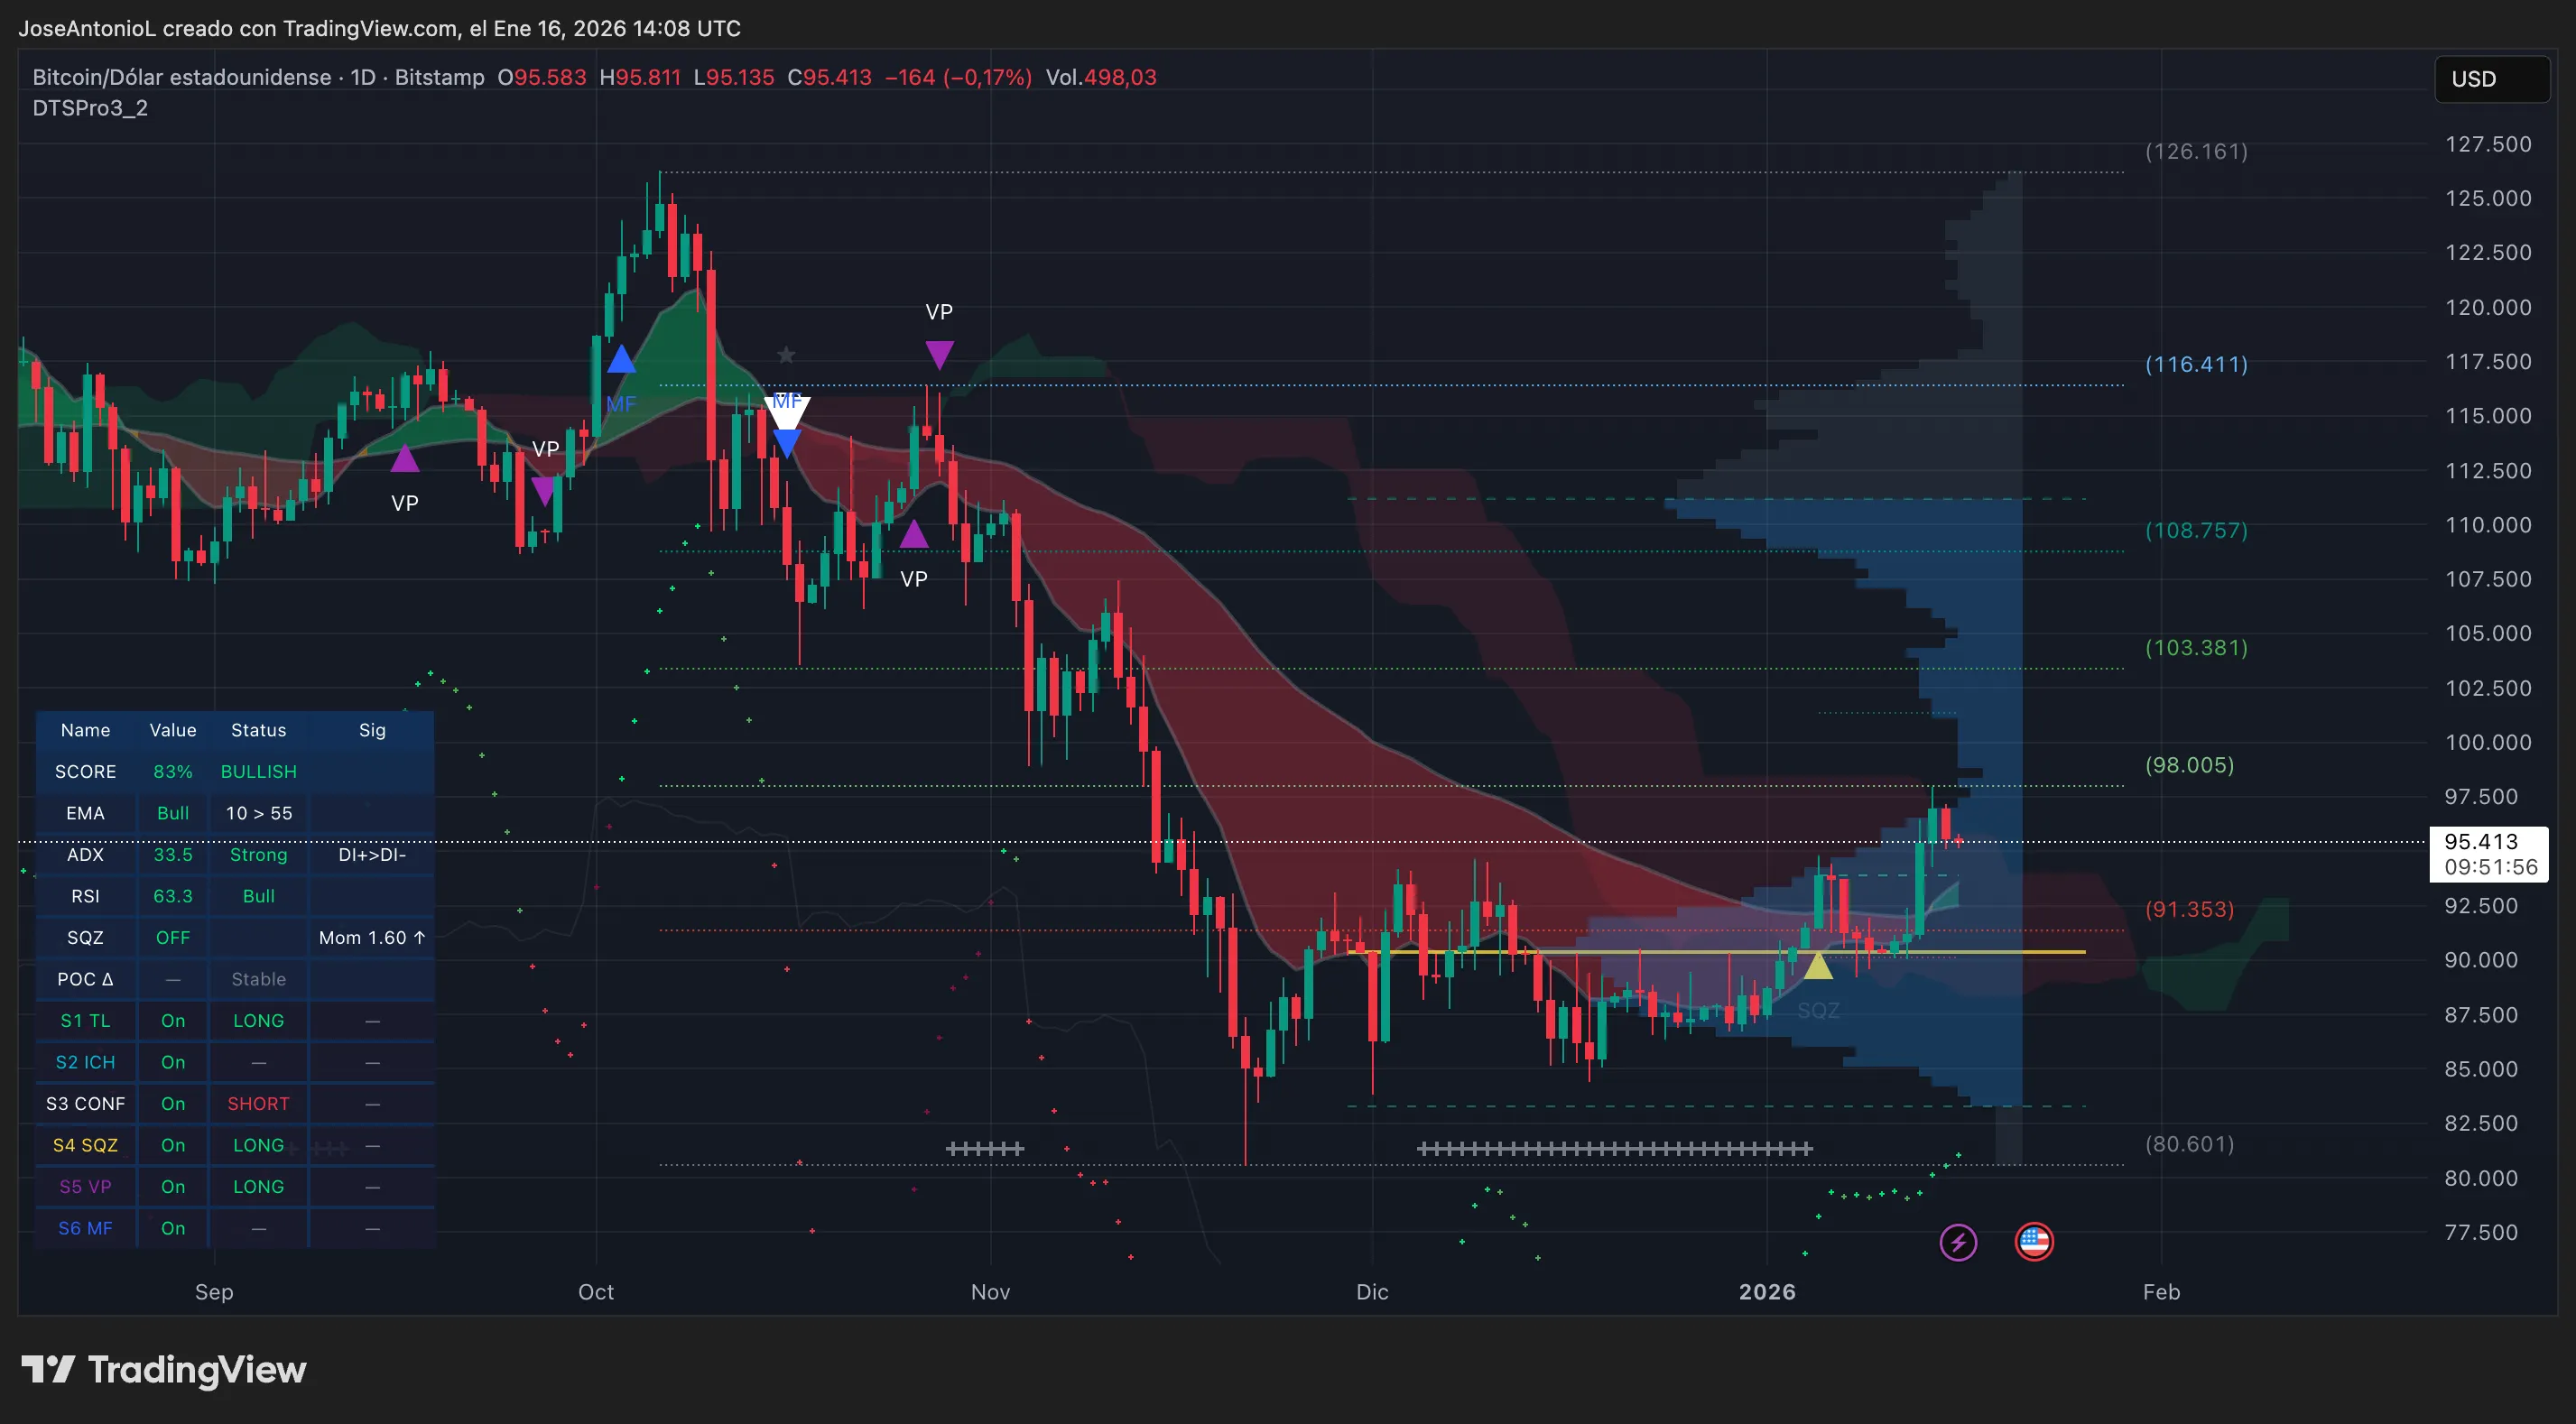
The Average Directional Index (ADX), which gauges trend strength regardless of direction on a scale from zero to one hundred points toward genuine momentum at around thirty-three point five—values exceeding twenty-five typically confirm meaningful trends rather than random fluctuations or noise seen below twenty where false breakouts prevail frequently.
The Relative Strength Index (RSI) currently reads sixty-three for Bitcoin—a measure comparing buying versus selling pressure also scaled zero through one hundred—with values above seventy indicating possible overbought conditions prompting profit-taking while readings under thirty suggest oversold levels attracting bargain hunters. Sitting comfortably within bullish territory but not yet nearing critical exhaustion zones implies room for further gains before traders might consider exiting positions en masse.
The Squeeze Momentum Indicator reveals positive upward movement following an extended period of low volatility (“compression”), marked visually by plus signs in related charts: such phases resemble coiled springs releasing energy once volatility expands again—here signaling bullish directional bias emerging strongly now post-compression phase end.
An EMA setup confirms these signals clearly: with BTC’s short-term fifty-period EMA positioned higher than its two-hundred-period counterpart—and current price sitting atop both averages—it forms what traders call “bullish alignment,” typically reflecting dominant upward momentum favoring buyers presently controlling price action dynamics strongly overall.
Caution remains warranted though because similar crosses occurred briefly last year between October first and thirteenth without sustaining long term rallies fully confirming trend reversals then.
If invalidated now , this golden cross could weaken support near EMA50 , leaving room for downside risks .
Resistance proves formidable around eighty – eight thousand dollars mark ; Fibonacci retracement levels drawn between all time highs near twelve six thousand dollars down towards recent lows reinforce technical barriers . The psychological milestone at one hundred thousand dollars compounds resistance creating what experts term “a double whammy”, where emotional trader behavior meets objective chart hurdles simultaneously .
On Myriad , Decrypt ‘ s parent company Dastan ‘ s prediction platform , optimism surges : odds favor BTC hitting six figures before dropping back below sixty nine thousand stand close eighty seven percent — climbing sharply since early January ’s sixty three percent baseline . Yet another separate betting pool shows less confidence regarding breaking previous all time highs before July with seventy three percent probability assigned against new records being set soonest .
This juxtaposition paints an intriguing scenario : technically supported upside potential backed by strong momentum indicators contrasts with cautious sentiment limiting expectations beyond certain thresholds historically tested previously . For active traders seeking balance across analytical frameworks combining chart patterns alongside crowd psychology data suggests adopting moderately bullish stance short term while maintaining vigilance long haul awaiting decisive breakthroughs especially approaching key resistance zones like “$100K”.
Critical Price Levels To Monitor
Resistance:
$98,000 (Fibonacci/metiate)
$100,000 (pyschological barrier)
$108,757 (nex t Fib level )
S uppor t :
$91 , ;353 (s tr ong suppor t )
$89 , ;00 0 ( h i g h volume low )
< P>$80 601(breakdown level)</P>
<P>Disclaimer</P>
<P>The VIEWS AND OPINIONS EXPRESSED BY THE AUTHOR ARE FOR INFORMAT IONA L P U R PO SE S O N L Y A N D D O N O T C O N ST I T U TE F I NA NC IA L , I NV ES TM EN T , OR OT HE R AD V IC E 。</P>