Bitcoin spent the weekend moving largely within a familiar price corridor before dipping briefly and then recovering as traders responded to the unfolding consequences of the Iran conflict.
Although macro‑economic headlines now dominate Bitcoin’s price action more than fundamentals or adoption metrics, the chart’s key testing zones remain unchanged.
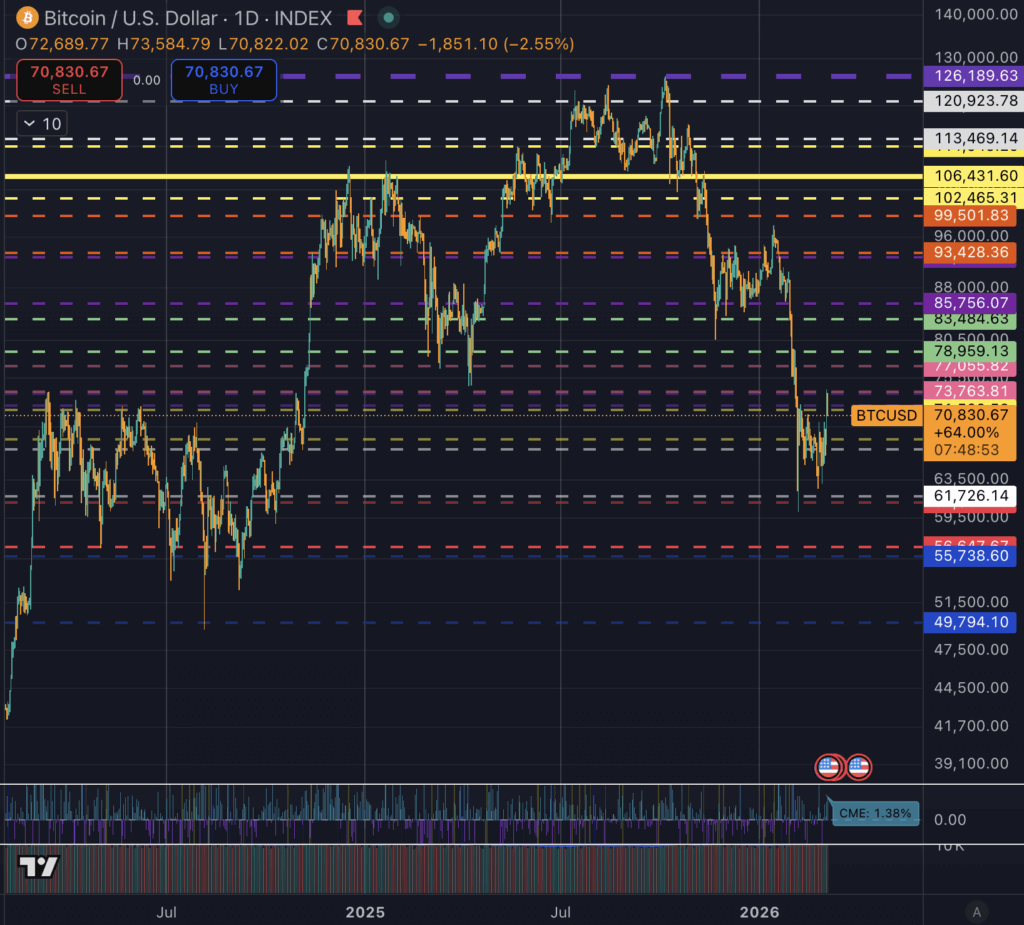
Since Friday Bitcoin has probed both long‑term support and resistance levels. With market makers back at their desks it has bounced back into the centre of a price channel that has appeared repeatedly since early 2024.
This recurring pattern explains why I have continued to rely on the same channel framework after spot Bitcoin ETFs launched earlier this year.
The channels consistently highlight zones where BTC is most likely to stall, rebound or break out into a fresh range, offering a clearer view of market structure than raw price moves alone.
The Akiba Price Channel Indicator
Over the weekend I created a tool based on this framework. Rather than depending on static chart screenshots it monitors Bitcoin’s interaction with these channels in real time, flagging significant bounces and breakouts for faster and cleaner analysis.
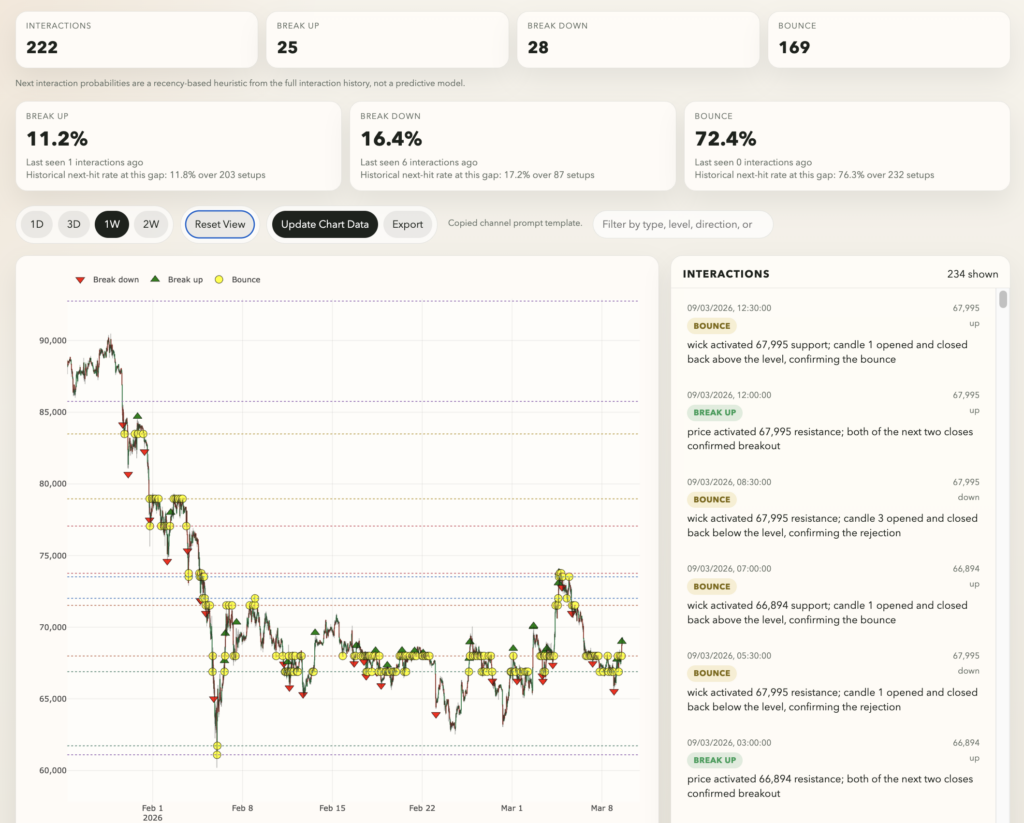
The dataset derives from manually drawn horizontal channels that I have tracked for more than two years. Levels are chosen by hand—not by algorithms—and combine round‑number psychology, historic reaction zones, order‑book depth and leveraged futures accumulation. Interaction labels are intentionally narrow.
- A “break up” occurs when BTC crosses a boundary without first being rejected.
- A “break down” means crossing in the opposite direction.
- A “bounce” indicates that price hit the line and stayed within—or returned to—the channel structure.
This approach does not attempt to predict direction; it simply shows where the market has already reacted and where similar reactions are likely again.
The historical record heavily favours rejections over escapes: across all observations BTC logged 234 interactions—178 bounces, 30 breakdowns and 26 breakups—giving a bounce rate of 76 %.</
Since March 3 the pattern holds: 54 interactions comprised 41 bounces, seven breakdowns and six breakups. A simple recency heuristic (not a predictive model) suggests an upcoming bounce probability of 72 %, versus 16 % for a breakdown and 11 % for an upside breakout.</
</