This analysis is provided daily by Omkar Godbole, a CoinDesk analyst and Chartered Market Technician.
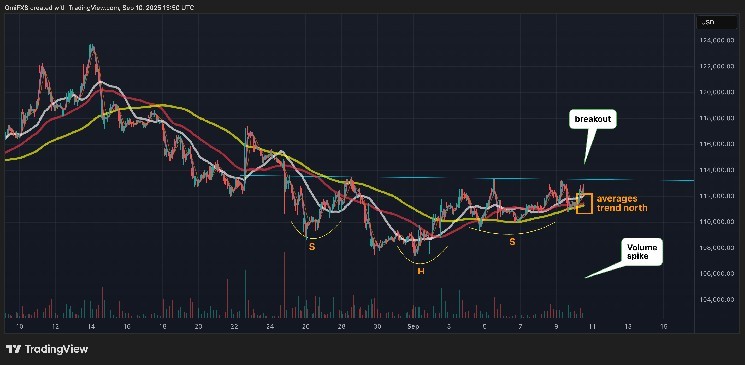
The recent U.S. Producer Price Index (PPI) figures came in lower than anticipated, propelling Bitcoin BTC$114,067.48 beyond the $113,600 mark. This movement validates the bullish inverse head and shoulders pattern that was identified earlier this week.
This breakout indicates a conclusion to the recent decline from its peak above $124,000 and marks a return to an overall upward trend. By employing the measured move technique—which calculates the distance between the lowest point of the pattern and its breakout level—analysts suggest that Bitcoin could potentially approach nearly $120,000.
The upward momentum is reinforced by rising simple moving averages (SMAs) across 50-, 100-, and 200-hour intervals. Furthermore, a positive shift in market sentiment is confirmed as evidenced by the MACD histogram on daily charts crossing above zero.
Looking ahead, bulls might face resistance near the significant 50-day SMA at approximately $114,700. Conversely, bears will likely target challenging support at around $110,000—the most recent higher low established during this period.
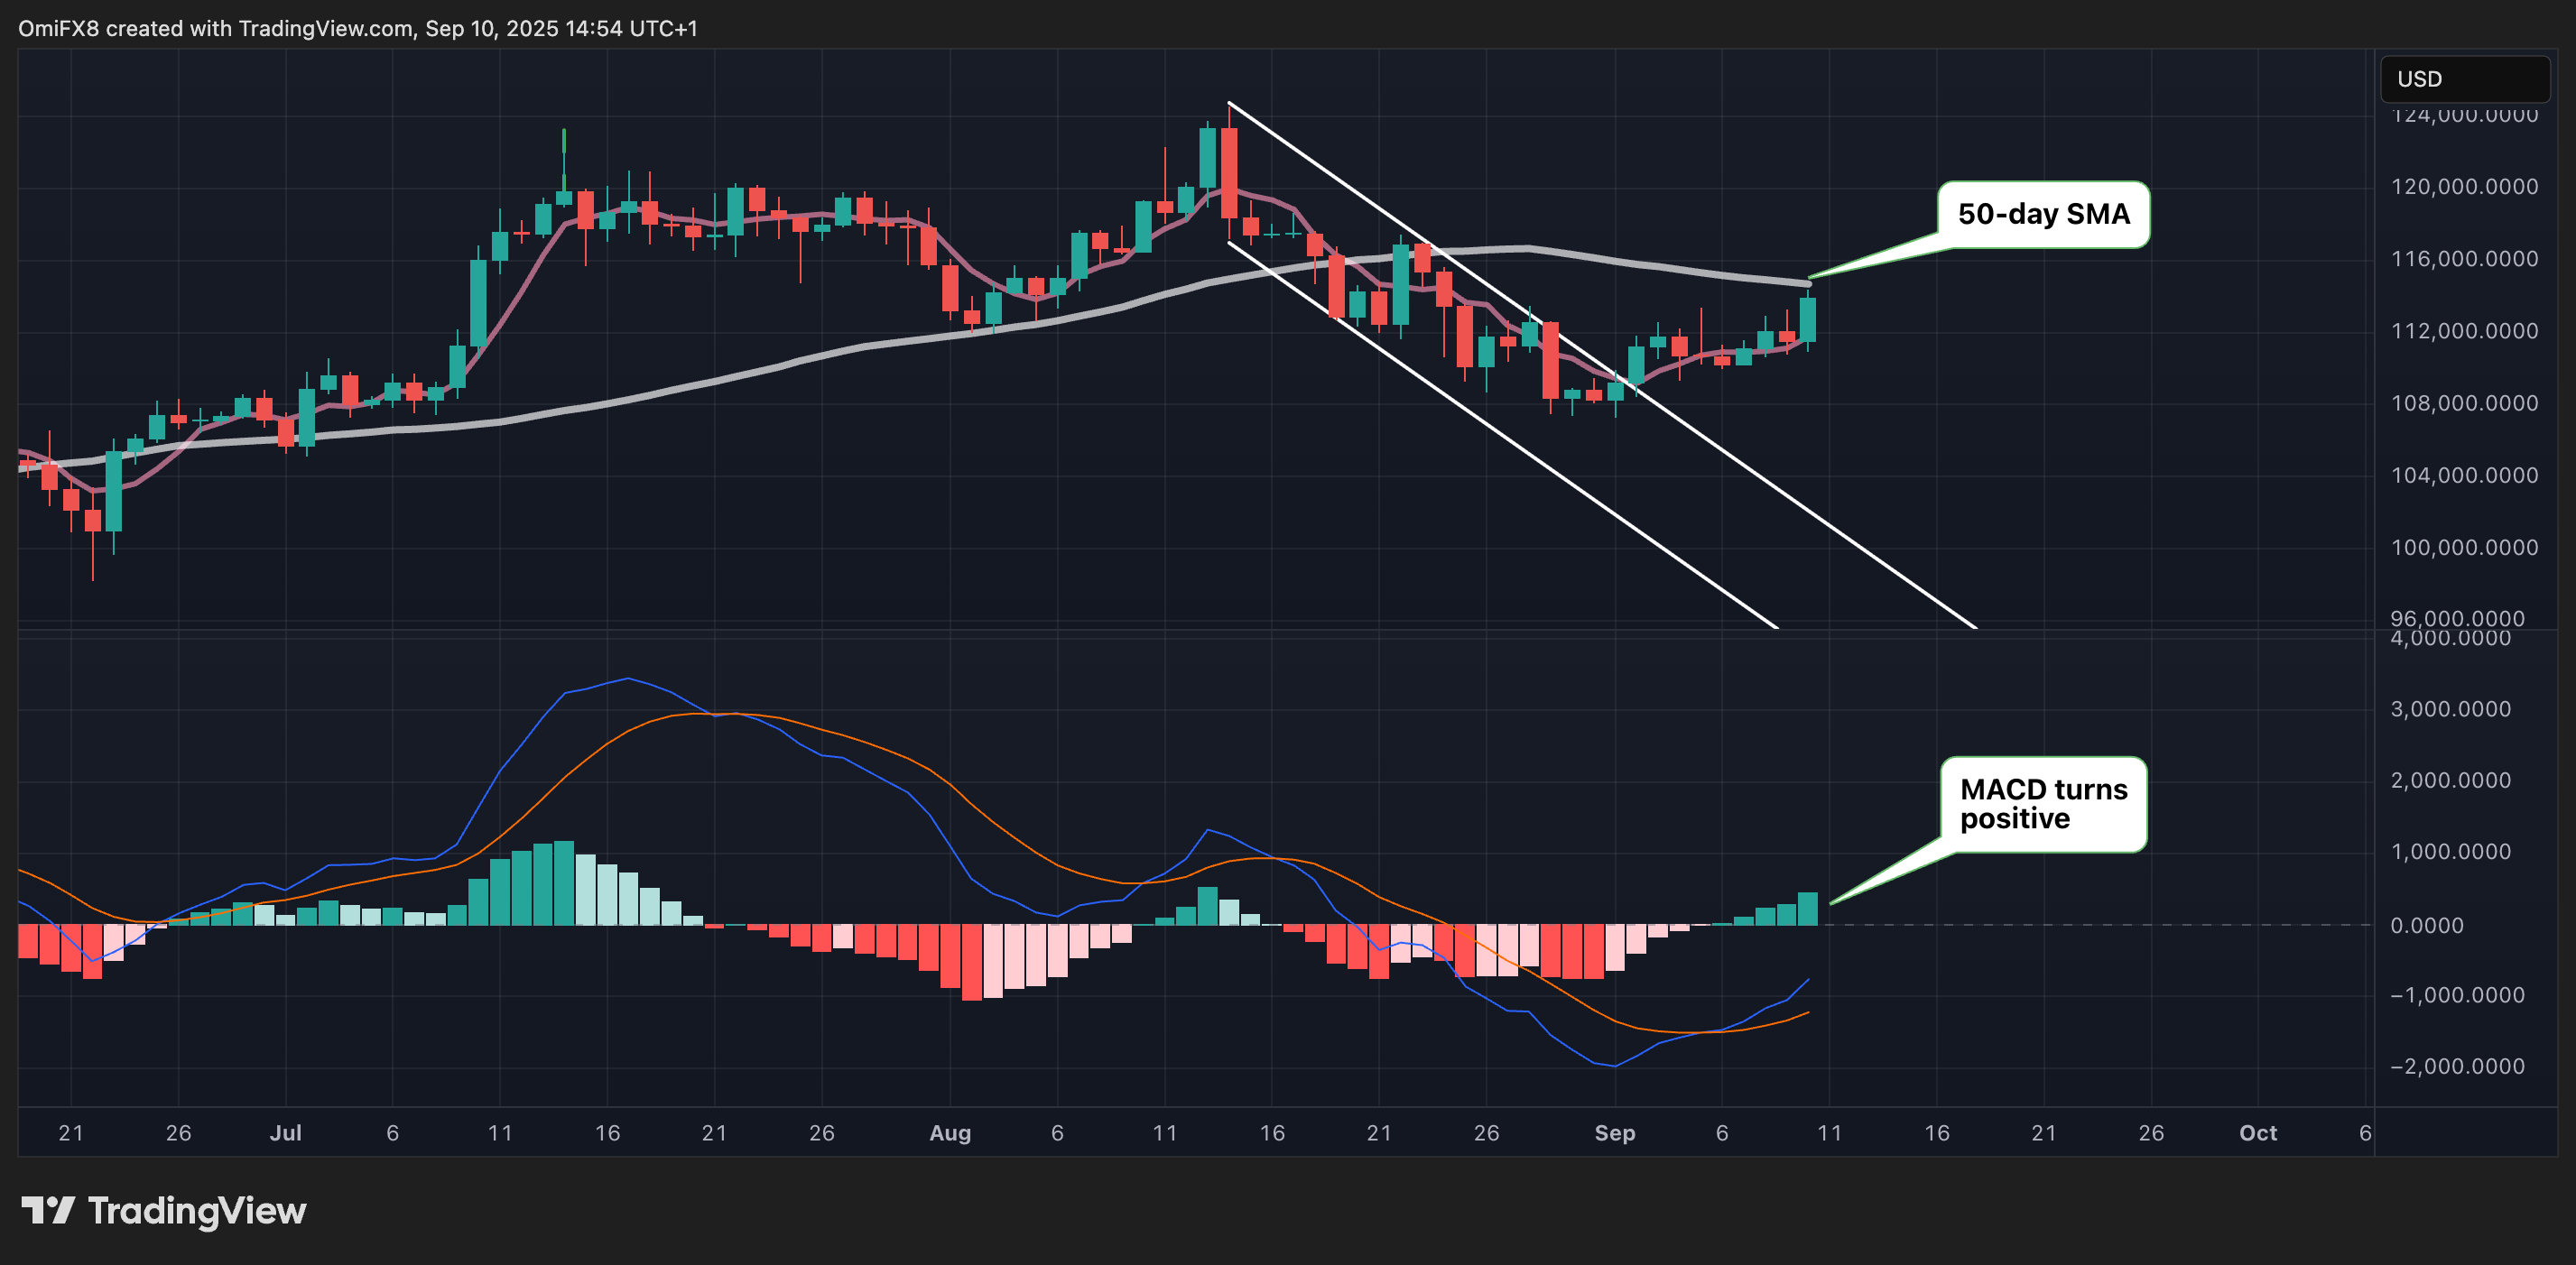 BTC’s MACD has turned bullish. (Tradingview/CoinDesk)