Bitcoin retreated to around $91,000 on Tuesday after briefly climbing back to $94,000 the previous day.
New data revealed significant selling pressure near critical resistance levels, despite underlying indicators showing improved demand.
Massive Sell Orders Restrict Bitcoin’s Advance Near $95,000
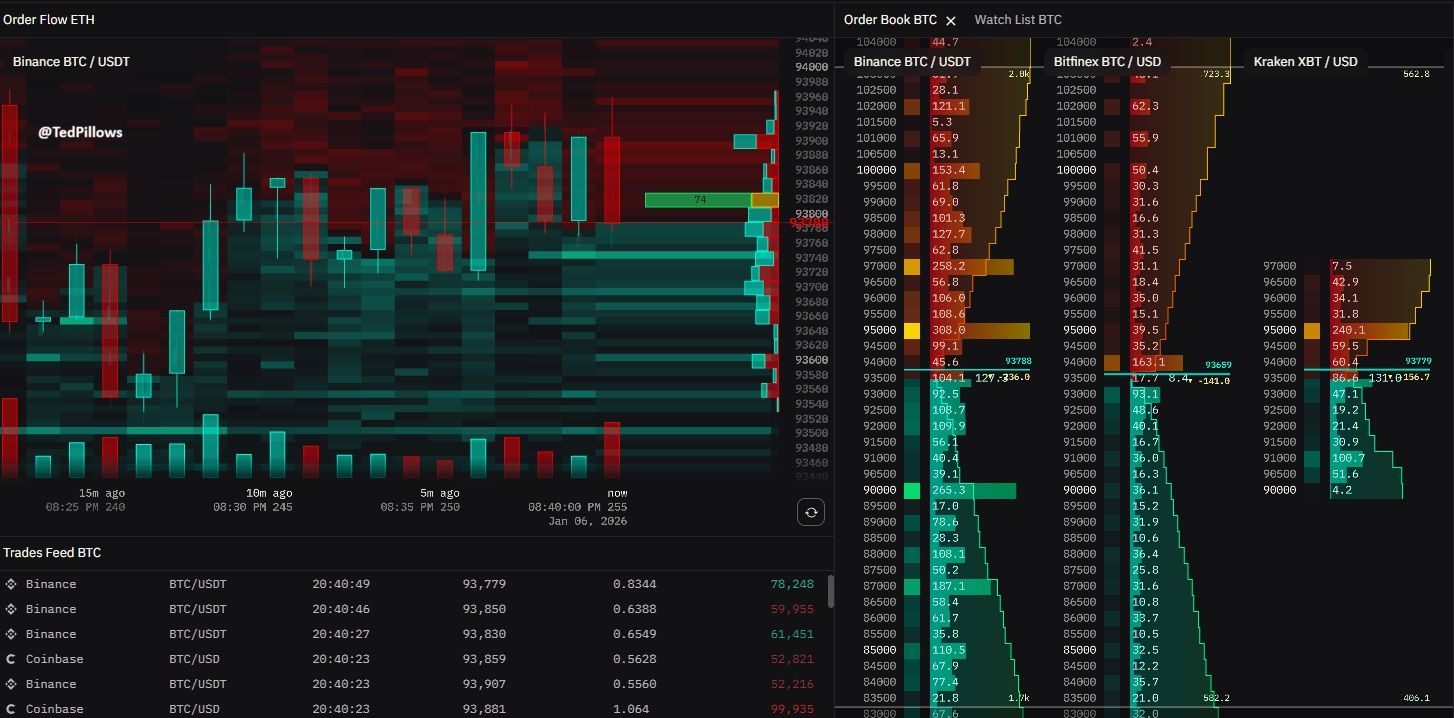
The recent decline came after Bitcoin failed to break through the $94,000–$95,000 range. Order book analysis indicated nearly $100 million worth of sell orders concentrated across major exchanges at this level.
This dense liquidity acted as a barrier that stopped the upward momentum and triggered short-term profit-taking among traders.
The area around $91,000 serves as an entry point for a large group of buyers who entered early in 2025. These participants appear to be locking in modest profits following recent price swings.
Heatmaps from order books showed sellers absorbing buying pressure as Bitcoin approached this zone.
When upward momentum stalled, leveraged traders began closing positions rapidly, accelerating the drop back toward $91,000. This movement reflected typical market mechanics rather than a sudden change in sentiment.
Most of the short-term downside liquidity has been taken out.
Probably one more flush towards the $90,500-$90,800 level before the reversal. pic.twitter.com/FnWjP2FpuP
— Ted (@TedPillows) January 6, 2026
A Price Rebound Remains Likely
Despite this pullback, on-chain metrics and flow data indicate that overall market conditions remain positive for Bitcoin’s longer-term outlook.
According to CryptoQuant data, Binance’s Bitcoin-to-stablecoin reserve ratio has begun rising again—a sign that buying power is accumulating off-market waiting for opportunities.
Binance Bitcoin/Stablecoin Ratio Signals Rising Buying Power
“This ratio has started to move higher again. This shift could mark early stages of gradual deployment of sidelined liquidity which would represent a very positive signal for markets.” – By @Darkfost_Coc pic.twitter.com/eIuQeekNEt
— CryptoQuant.com (@cryptoquant_com) January 6, 2026
An increasing ratio suggests traders are holding stablecoins ready to deploy capital during dips rather than chasing rapid breakouts—typical behavior ahead of consolidation phases where prices trade sideways before making decisive moves later on. Such patterns rarely support sharp rallies immediately but set up healthier growth over time.
Institutional interest remains strong as well: Spot Bitcoin ETFs saw net inflows close to $697 million on January 5th alone pushing total inflows near an impressive $58 billion mark overall.
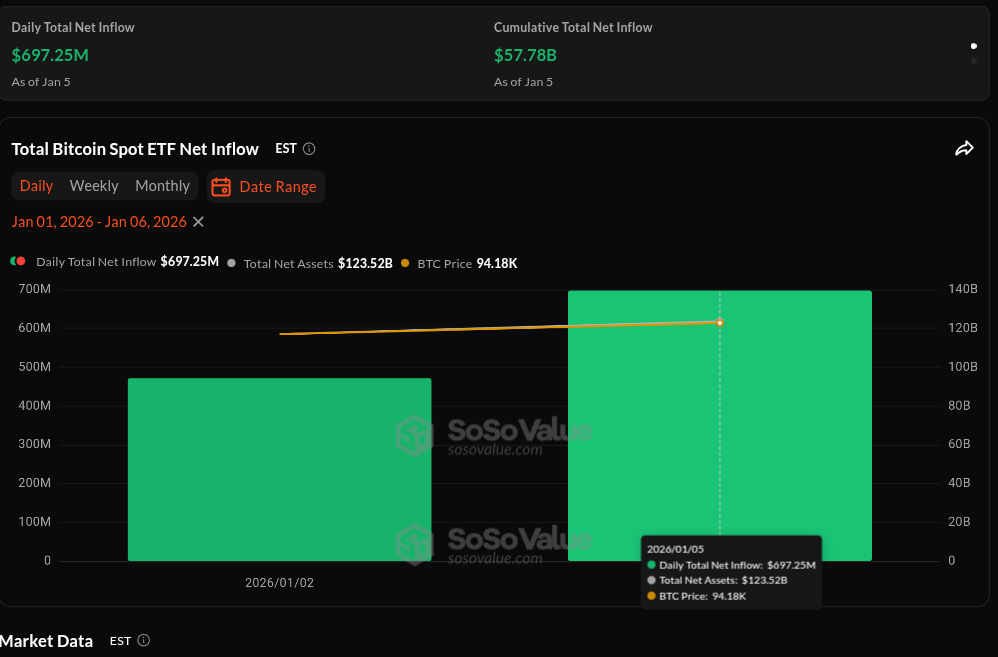
This sustained influx continued even while price struggled against resistance levels suggesting long-term accumulation rather than speculative hype is driving demand currently.
The divergence between robust ETF inflows and short-lived price weakness highlights contrasting behaviors within market participants: long-term holders steadily accumulate whereas short-term traders react quickly around technical barriers and clustered liquidity zones.
This explains why gains above roughly $94K couldn’t hold without triggering broader sell-offs among shorter horizon players.
No evidence pointed toward heavy exchange deposits or aggressive selling by major holders during this dip either.
Presently , all signs point toward ongoing consolidation instead of outright reversal . Breaking above & #36 ; 95 , 000 will likely require persistent spot buying , reduced sell-side supply , plus supportive moves across correlated risk assets .
Until then , retracements into low & #36 ; 90 , 000 territory seem consistent with healthy digestion following recent advances .
The original article titled “Bitcoin Hits a & #36 ;100 Million Sell Wall as New Buyers Take Profit” was first published by BeInCrypto .