
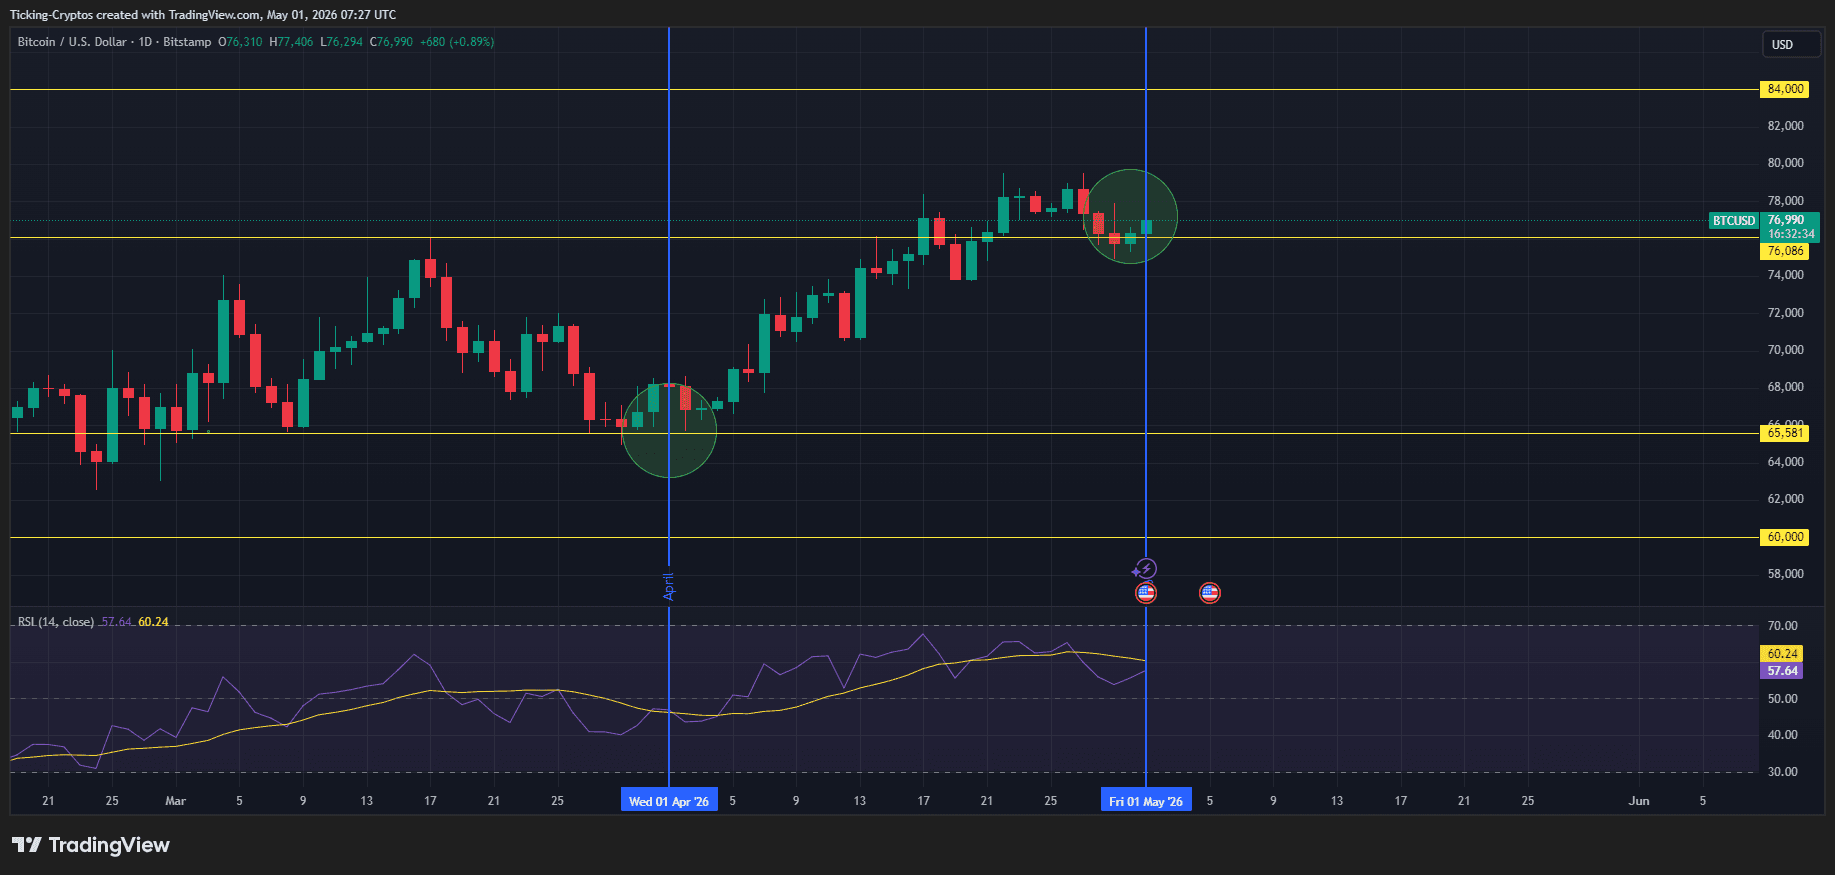
Bitcoin ($BTC) has wrapped up April 2026 with a remarkable gain of 11.87%. Following a volatile first quarter that saw the cryptocurrency dip from its early-year highs, this monthly performance signals a significant shift in market sentiment. Notably, Bitcoin’s price closed above its Monthly Previous High (MPH) of $75,900—an essential benchmark that analysts monitor for signs of macro trends.
Is Bitcoin Back in Bullish Territory?
The closing price for April stands at around $76,580, indicating that the “Q1 correction” may have found its bottom. By surpassing last month’s peak, $BTC has invalidated the pattern of lower highs observed earlier this year. This technical achievement suggests that May’s crypto news will likely focus on a potential surge towards the $80,000 threshold.
The Importance of Monthly Previous High (MPH)
In technical analysis circles, the Monthly Previous High serves as a pivotal point to assess long-term trend strength.
- Support/Resistance Flip: When prices close above last month’s high ($75,900), this level shifts from being an upper barrier to becoming a structural support base.
- Trend Confirmation: Closing over the MPH indicates strong demand capable of absorbing selling pressure even at higher prices—pointing toward further upward movement.
An In-Depth Look at Bitcoin Price Analysis for April Momentum
The rebound seen in April was fueled by various technical indicators and renewed institutional interest absent during March’s downturn.
1. Moving Average Convergence
As we enter May 2026, Bitcoin is trading well above crucial moving averages. The 20-day EMA ($72,150) has crossed back over the 50-day EMA ($70,400), forming what is known as a “bullish cross.” This configuration often serves as an impetus for price discovery phases ahead.
2. Institutional Buy-Side Pressure
The recovery in Bitcoin’s price aligns with increased Spot ETF inflows; data from April shows institutional investors resuming their accumulation strategies as prices stabilized above $70K—this liquidity helped push through the $75K resistance level effectively.
A Macro Perspective and Support Levels for May
This successful close in April lays down new groundwork for what lies ahead this quarter; however traders should keep an eye on retesting breakout zones to validate this bullish move’s strength.
| Level Type | Price Point | Significance | |
|---|---|---|---|
| New Monthly Support | $75, |
The “Breakout Line” |
|
| Psychological Support | $70, | Major liquidity zone and buyer interest | |
| Immediate Resistance | $78, | Local wick high from late April | |
| Primary Target
$82, Fibonacci extension level |
A Pivotal Breakout Ahead for $BTC
B itcoin’s performance throughout A pril has successfully mitigated bearish pressures witnessed earlier in th e year . With th e transition o f th e resistance at $7 ,9 into confirmed monthly support , th e market ha s cleared significant technical obstacles . Investors are now setting their sights on reaching towards th e logical milestone o f around$80 ,0.
FAQ:
<strong Q: What does it mean when Bitcoin closes above its previous monthly high?
A: Closing above its previous monthly high indicates strong buying momentum and can signal further upward movement.
<strong Q: How do moving averages affect Bitcoin trading decisions?
A: Moving averages help traders identify trends; when shorter-term averages cross over longer ones (like bullish crosses), it often indicates potential buy signals.
<strong Q: Why is institutional investment important for cryptocurrencies like Bitcoin?
A: Institutional investments provide liquidity and can lead to more stable pricing while also boosting overall market confidence.
<strong Q : What are key support levels I should watch?
A : Key support levels include psychological thresholds like$70 ,0and recent breakout points such as$7 .
A: Closing above its previous monthly high indicates strong buying momentum and can signal further upward movement.
A: Moving averages help traders identify trends; when shorter-term averages cross over longer ones (like bullish crosses), it often indicates potential buy signals.
A: Institutional investments provide liquidity and can lead to more stable pricing while also boosting overall market confidence.
A : Key support levels include psychological thresholds like$70 ,0and recent breakout points such as$7 .