
Bulls are more powerful than bears today, according to CoinStats.
BTC/USD
The rate of Bitcoin (BTC) has gone up by 2.6% over the past day.
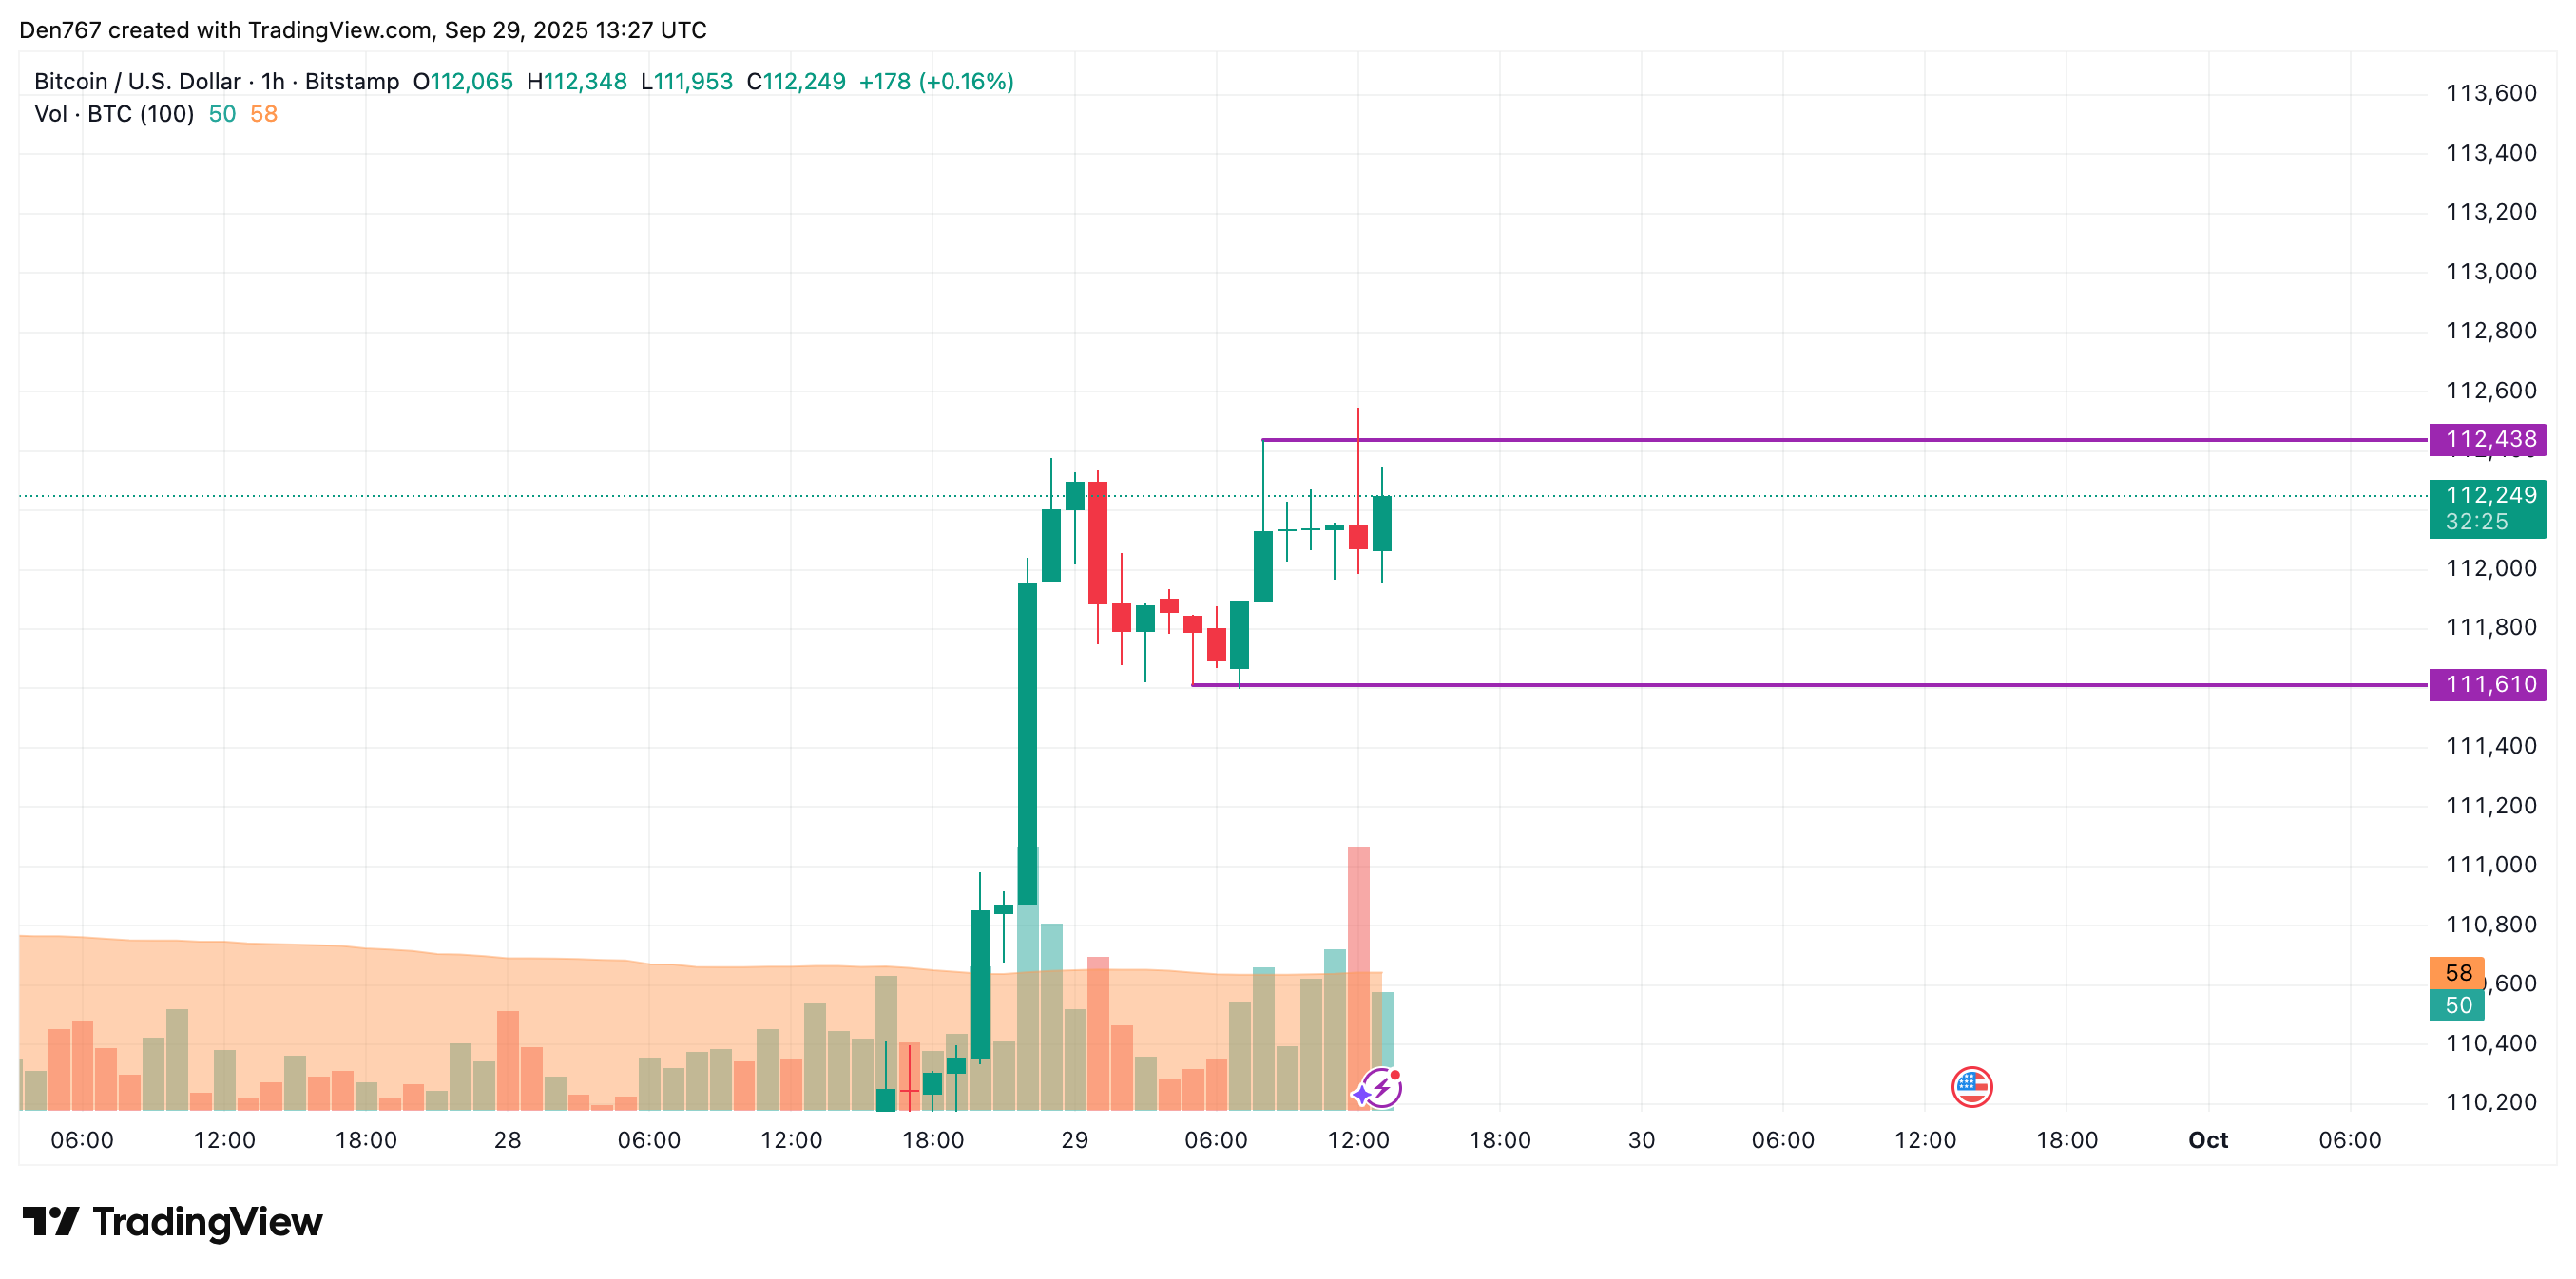
On the hourly chart, the price of BTC has made a false breakout of the local resistance of $112,438. However, if the daily bar closes near that mark or above it, bulls may seize the initiative, which may lead to a test of the $113,000 zone.
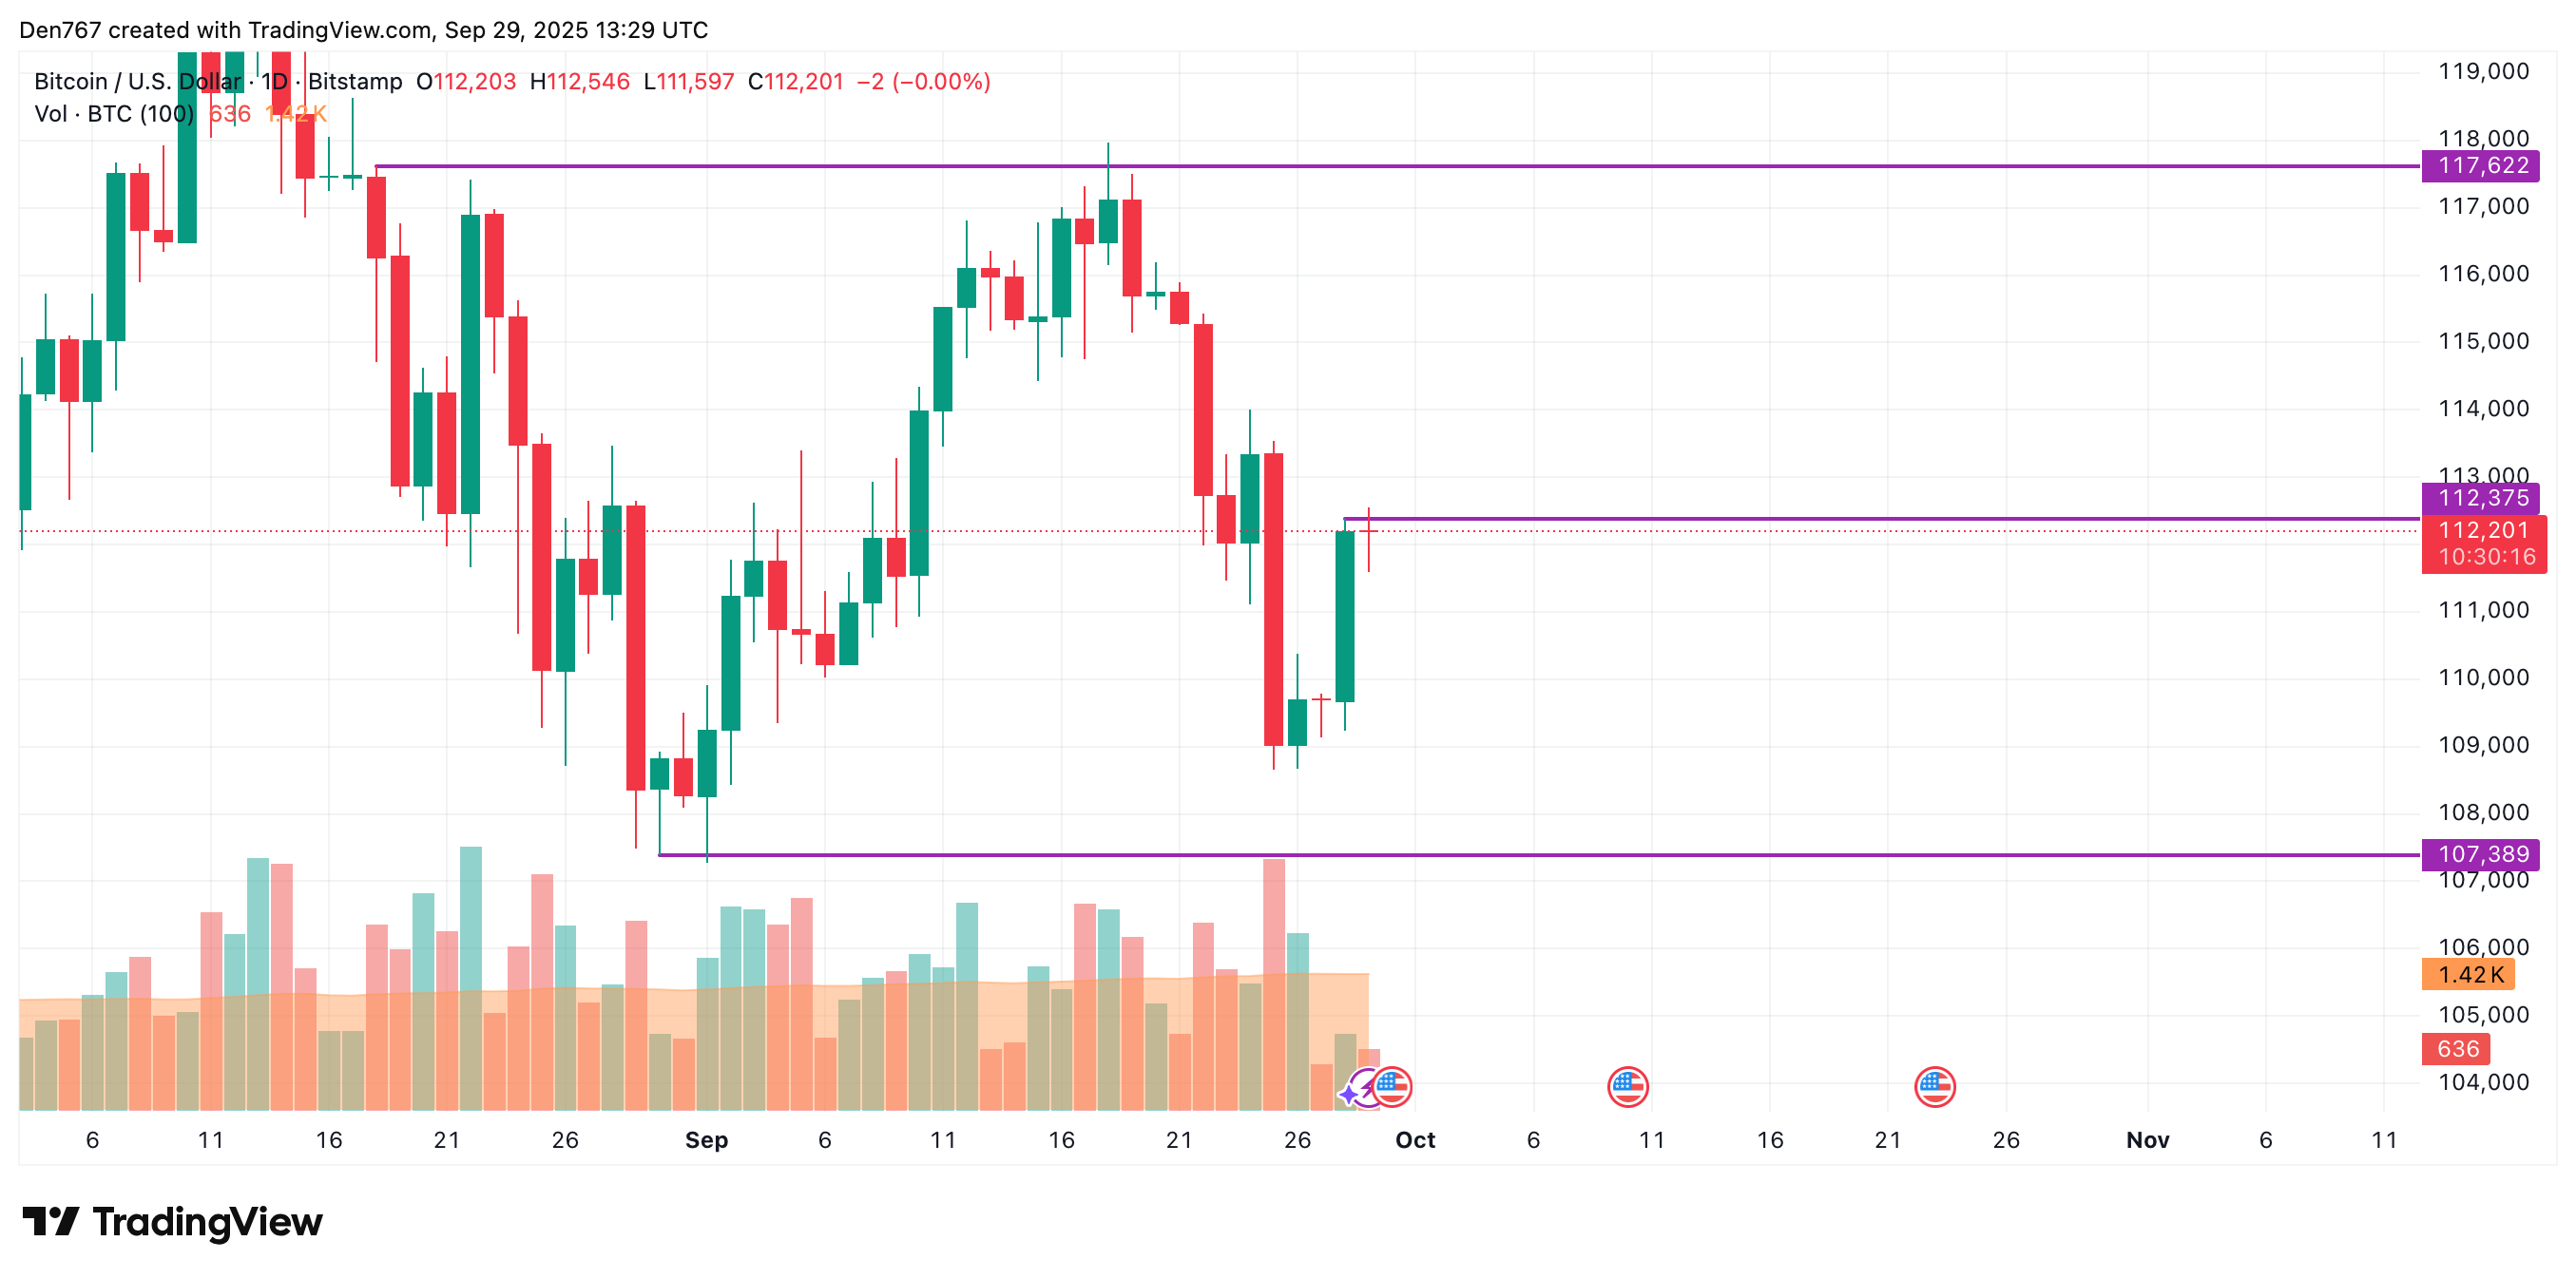
On the longer time frame, the rate of BTC is far from the support and resistance levels. In this case, one should pay attention to the daily candle’s closure in terms of yesterday’s bar’s peak.
If it breaks out, the upward move is likely to continue to the $114,000 area.
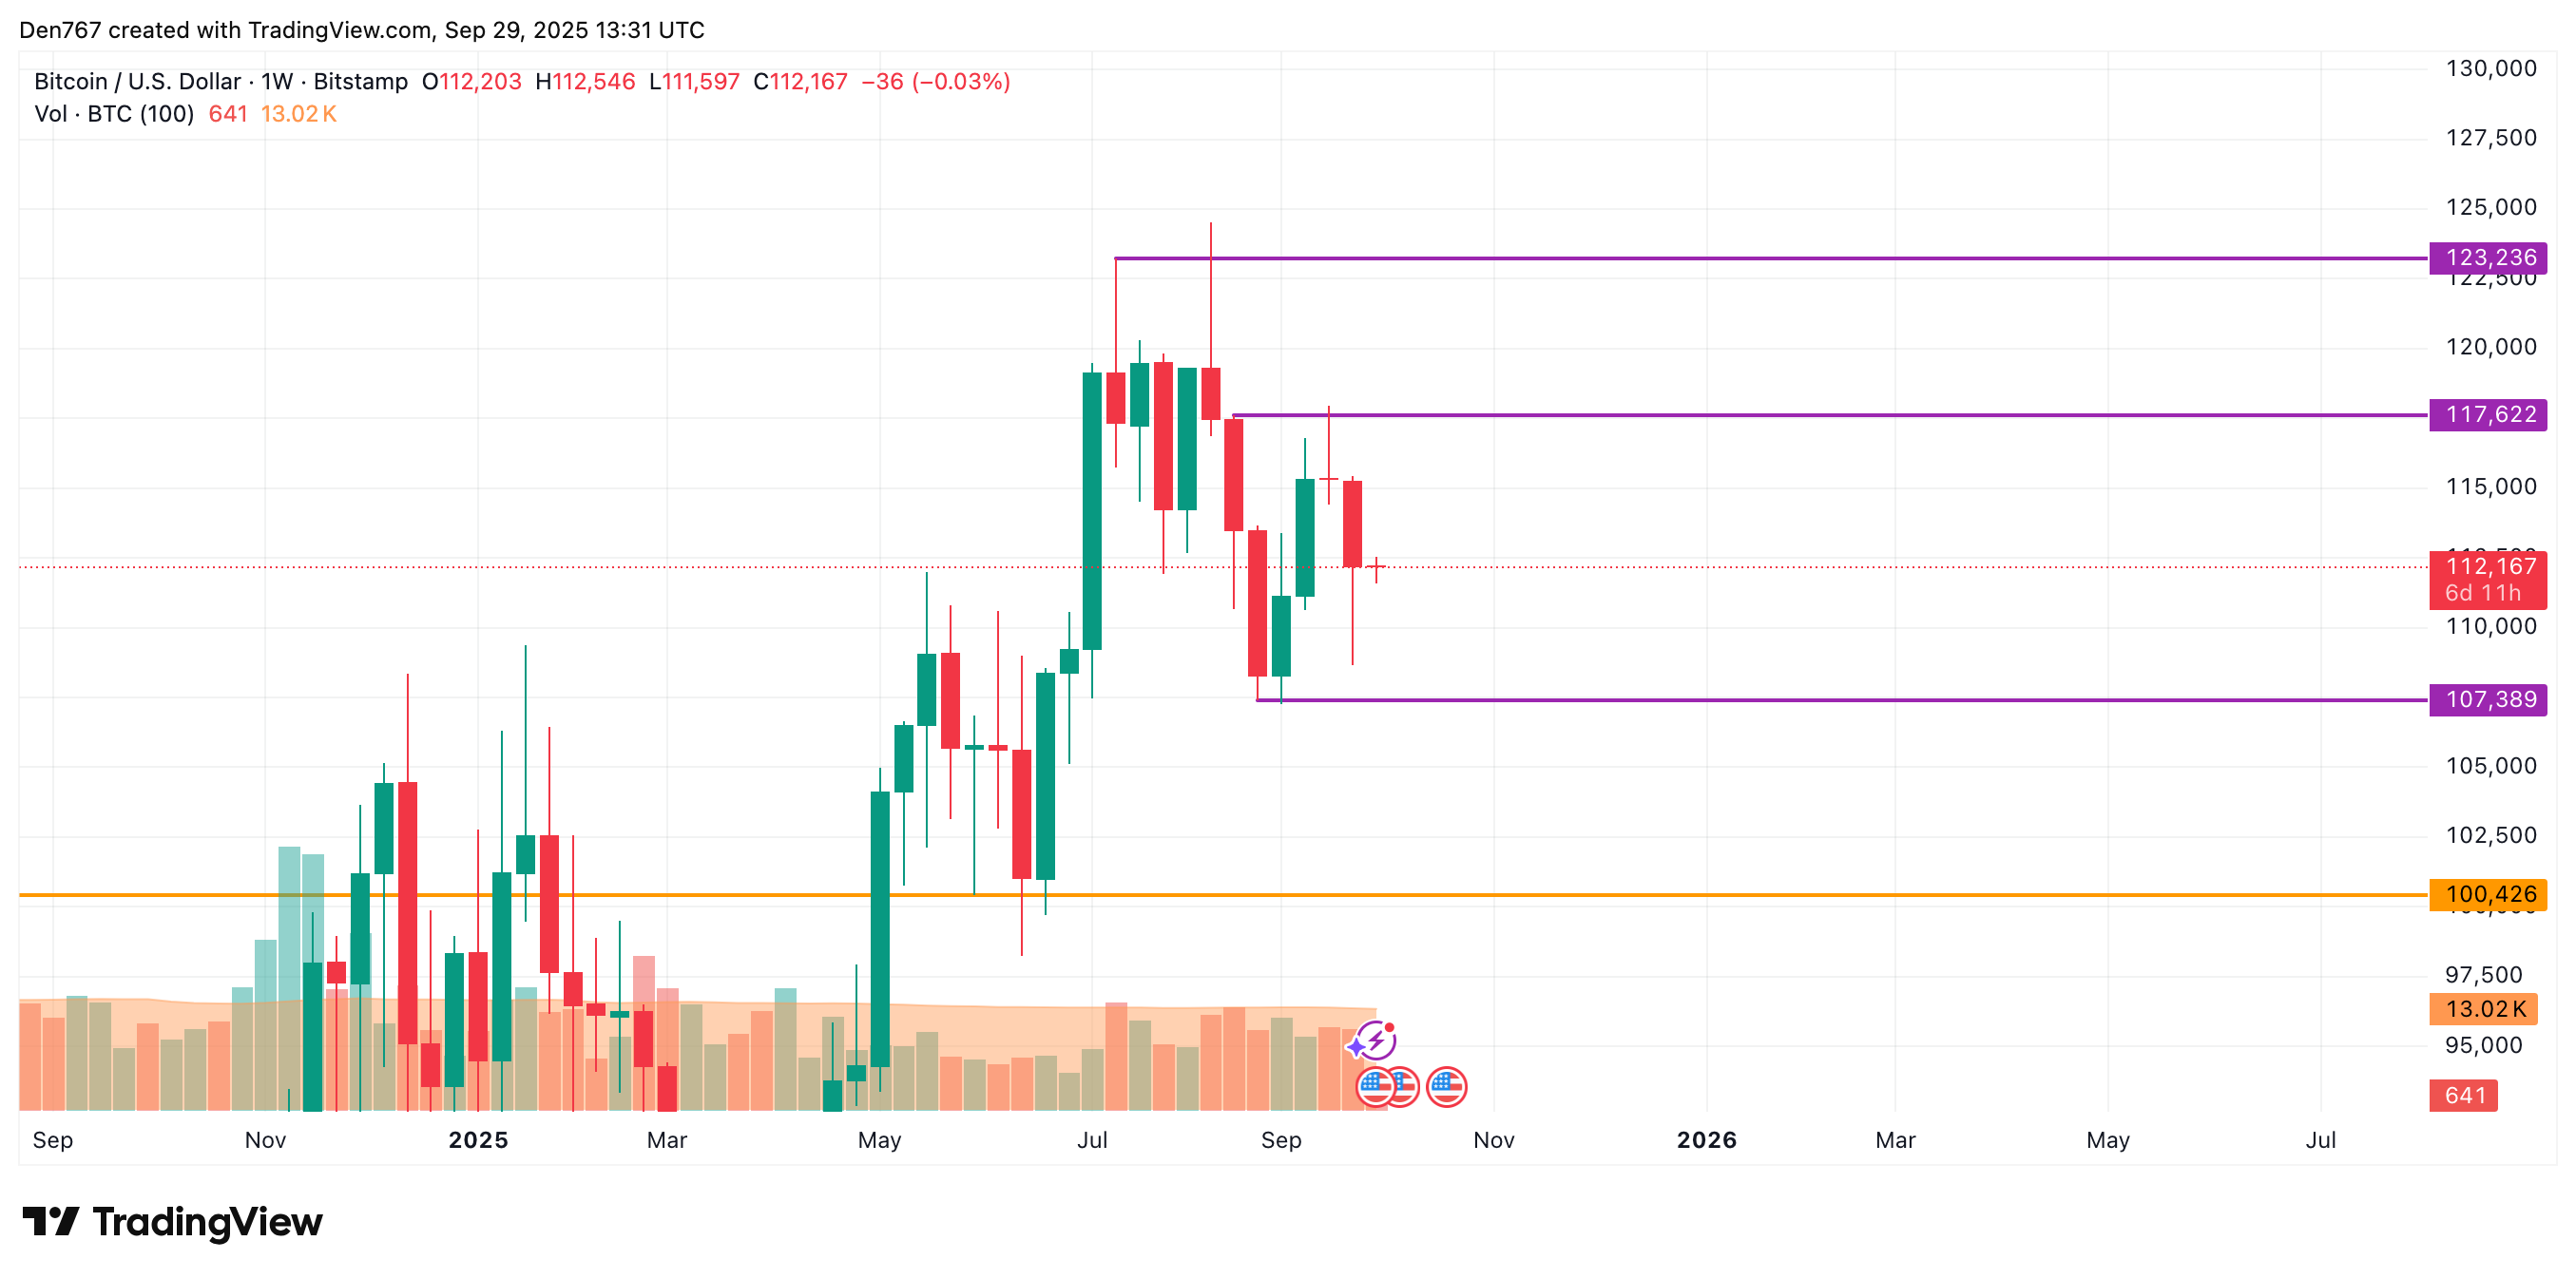
From the midterm point of view, none of the sides is dominating. Thus, the volume is low, confirming the absence of buyers and sellers’ energy. In this case, ongoing sideways trading in the range of $110,000-$114,000 is the more likely scenario.
Bitcoin is trading at $112,167 at press time.