Bitcoin experienced a notable surge of 2.7%, successfully breaching the downward resistance line that had constrained its rallies since October. A significant number of traders have adopted a bullish outlook, suggesting that $BTC has a 69% likelihood of reaching $84,000 next. However, the same traders assign only a 6.2% probability to Bitcoin achieving a new all-time high before July.
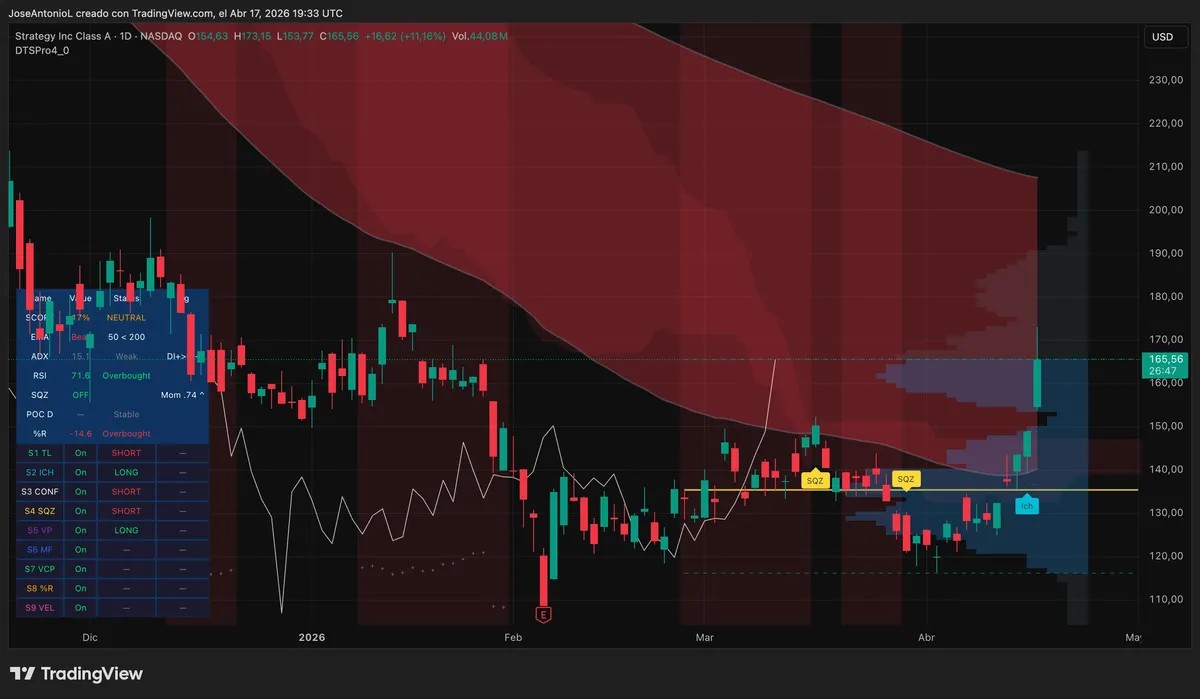
The cryptocurrency’s rise today was triggered by an unexpected geopolitical event: Iran declared that the Strait of Hormuz would remain open during the ongoing ceasefire, which led to falling oil prices and increased interest in risk assets. Following this announcement, Bitcoin briefly surpassed $78,000 before experiencing a slight pullback; meanwhile, digital asset treasury stocks like Strategy surged over 10%, as $BTC‘s ascent helped their holdings recover from previous losses.
The macroeconomic landscape has been challenging throughout most of 2026 due to rising tensions in the Middle East, inflation concerns, a robust dollar, and tight liquidity conditions—all contributing to Bitcoin’s steady decline from its peak of $126,000 in October 2025.
Bulls are hopeful for change this week.
Bitcoin: Breaking Free but Still at Risk
The candlestick pattern observed today on Bitcoin charts is noteworthy. Opening at $75,172 and peaking at $77,205—a gain of 2.7%—with an intraday high reaching $78,384 signifies potential momentum shifts.
This movement may seem modest but is crucial for reinforcing the notion that the descending resistance trendline rejecting every rally attempt since October 2025 has finally been breached. For seven months prior to this week’s trading above that line marked an end to what had become almost gravitational pressure on prices.
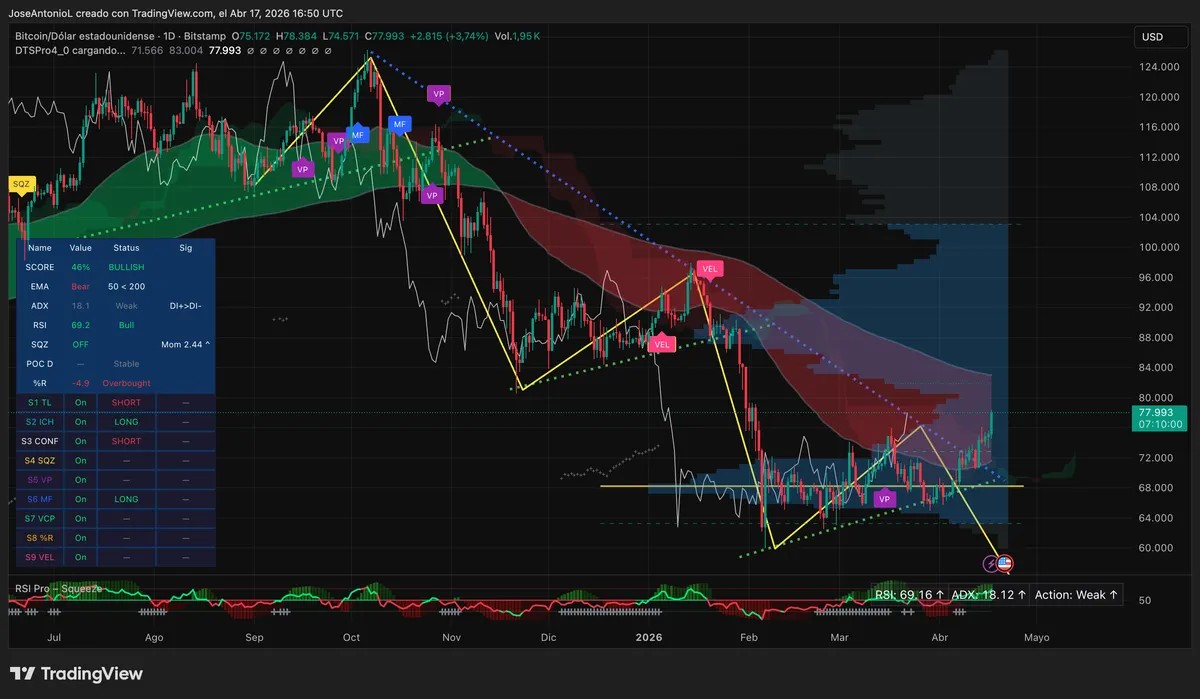
Since hitting its all-time high at $126K last year, Bitcoin has followed a classic descending channel characterized by lower highs and lower lows along with numerous failed breakout attempts becoming increasingly constrained over time. The yellow trendlines depicted indicate how for months now each bounce became less pronounced while support levels were tested more rigorously than before.
If this trend had continued unabatedly downward projections suggested logical support zones around $50K–$55K; however such scenarios appear postponed or even nullified now.
Encouraging signs are emerging for bulls as well: The Exponential Moving Averages (EMAs), which help traders gauge underlying trends based on historical price smoothing still reflect bearish sentiment—with the critical short-term EMA remaining below long-term averages—a phenomenon referred to as death cross among traders.
This situation matters because it signals structural weakness—the short-term trajectory remains weaker than longer averages indicating recovery efforts lack sufficient depth or sustainability needed for broader uptrend confirmation ahead lies steep challenges ahead still despite recent gains made thus far!
Nonetheless it marks first instance since January where gap between both EMAs begins narrowing again signaling possible shift ahead?