Bitcoin is currently hovering in a narrow price band, fluctuating between $91,698 and $92,022 over the last hour. Despite maintaining a robust market capitalization of approximately $1.83 trillion and a healthy 24-hour trading volume near $61.45 billion, the premier cryptocurrency appears to be cooling down after recent volatility, having dropped from an intraday high of $94,343 to a low around $91,544.
Analysis of Bitcoin’s Price Movement
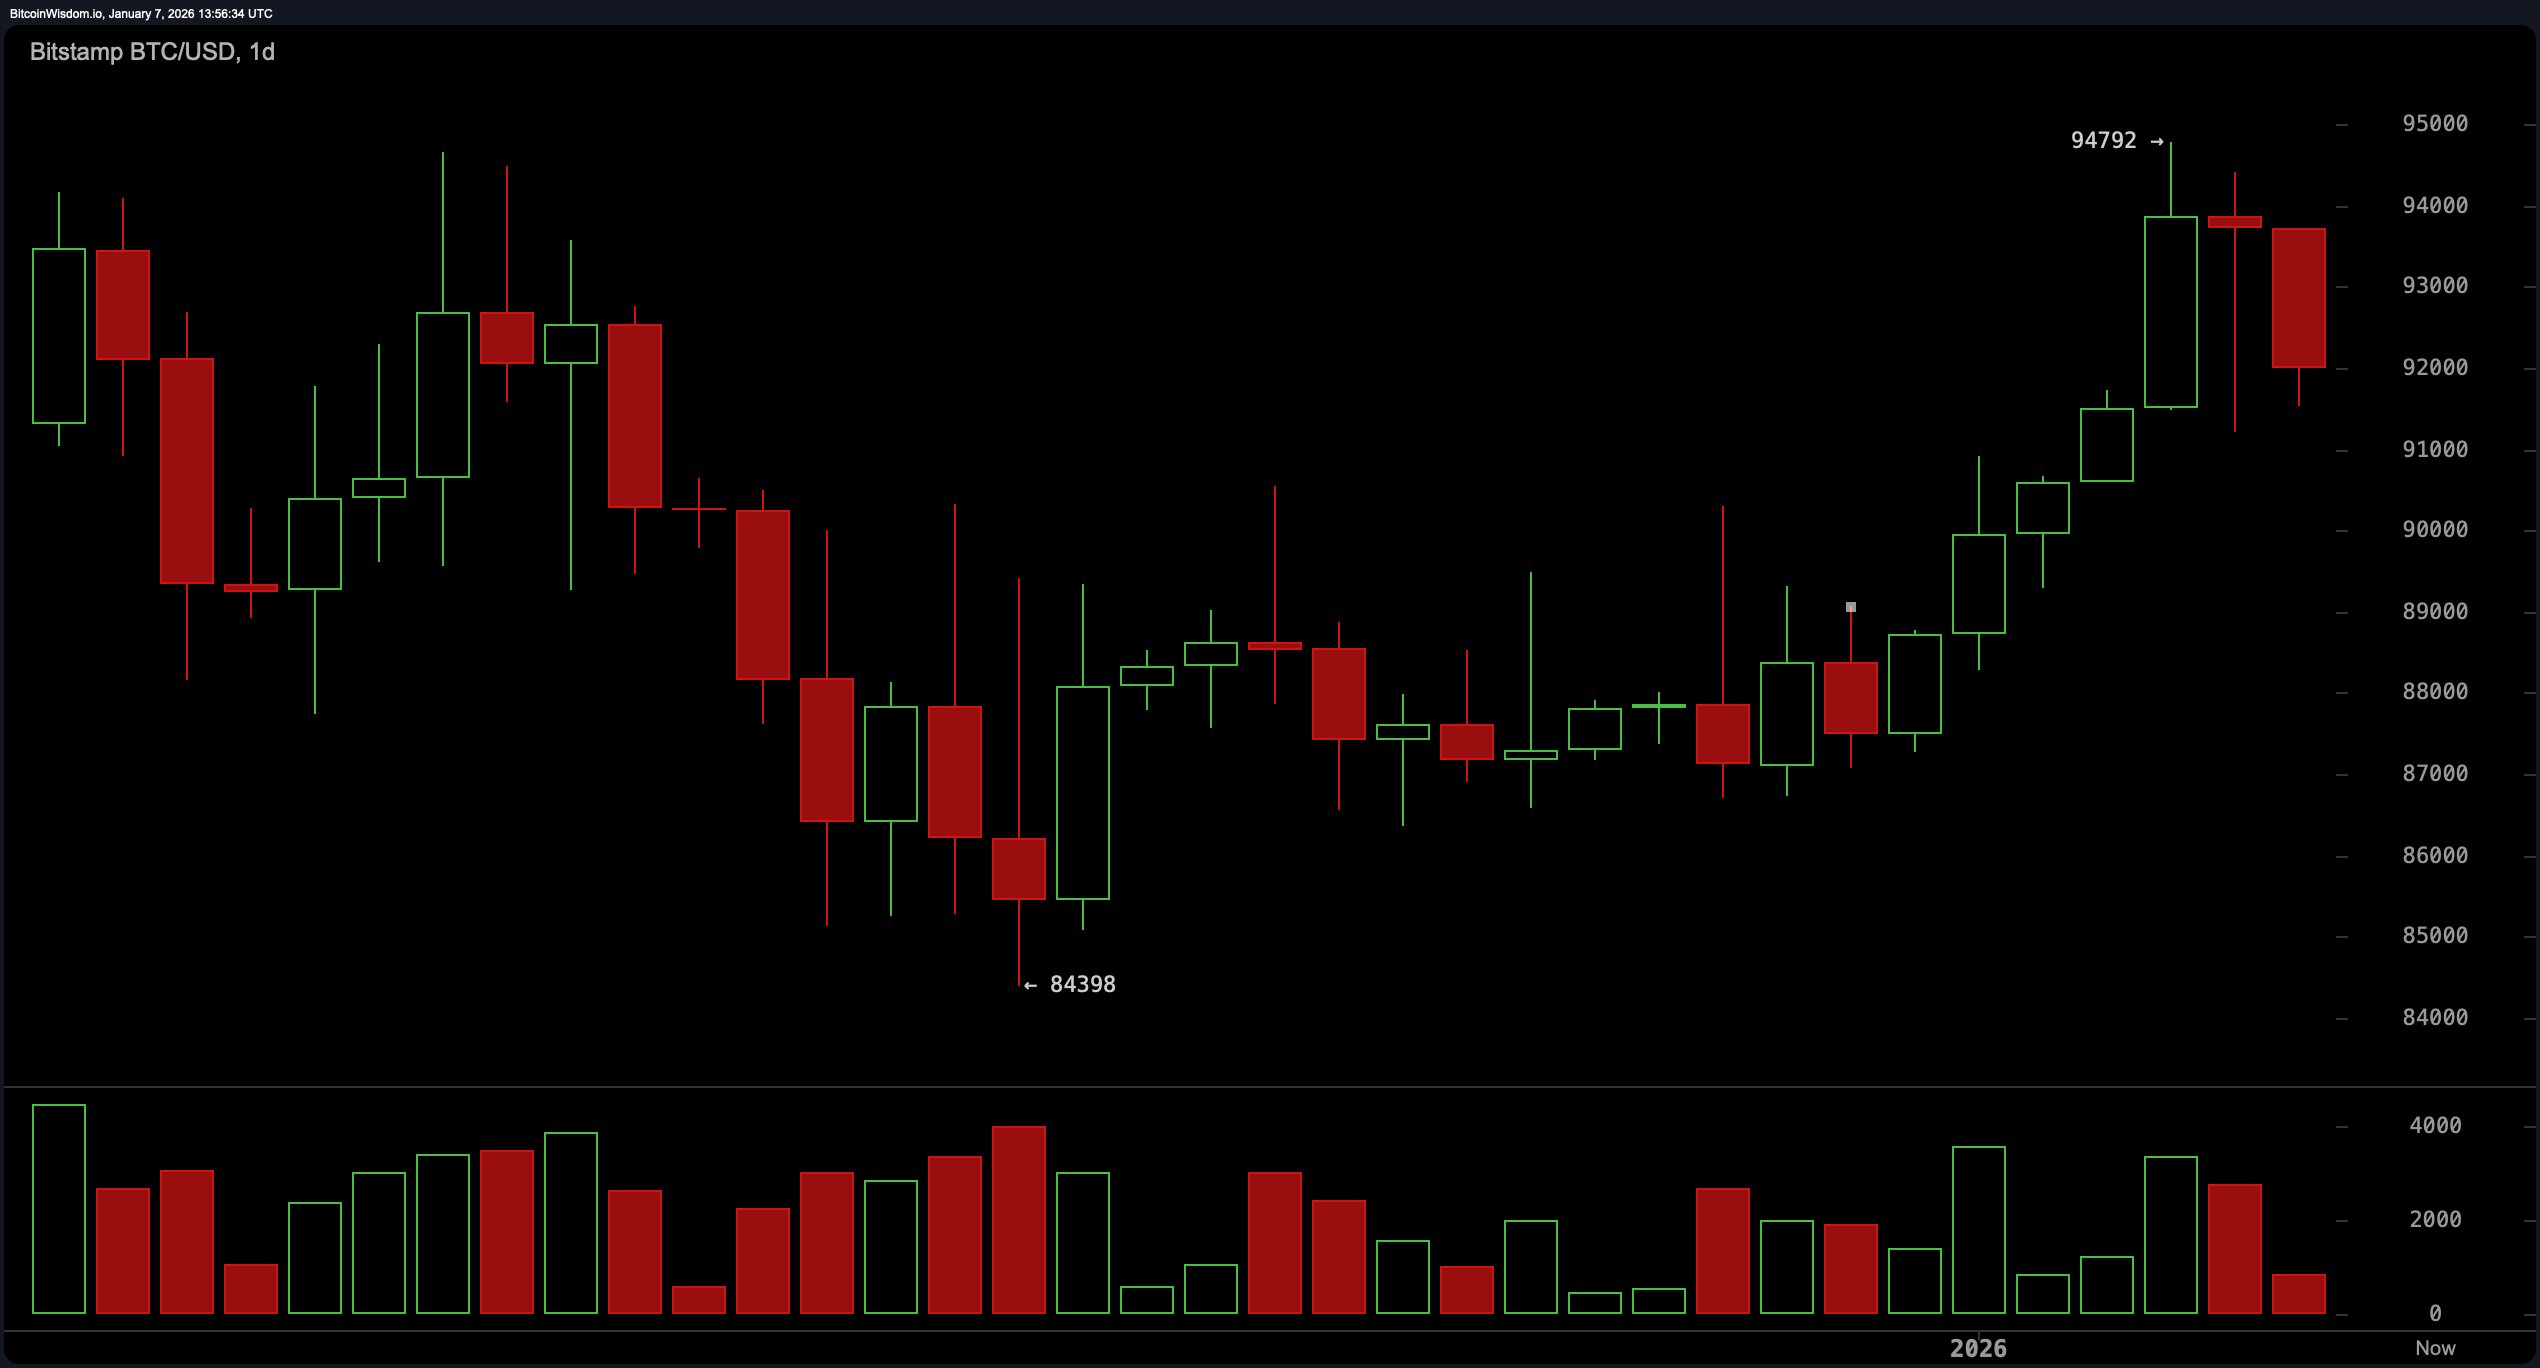
Examining the daily chart reveals signs of fatigue following Bitcoin’s strong rally from roughly $84,398 up to nearly $94,792. However, enthusiasm waned prematurely as resistance levels around the $94,000–$95,000 range halted further gains. The presence of sizable red candlesticks paired with elevated volume suggests that distribution might be underway—potentially indicating institutional investors quietly exiting their positions.
The support zone between $88,000 and $89,000 remains crucial; it acts as a key neckline level. Should prices retreat back into this area, traders will closely watch for either a rebound or continued downward momentum.
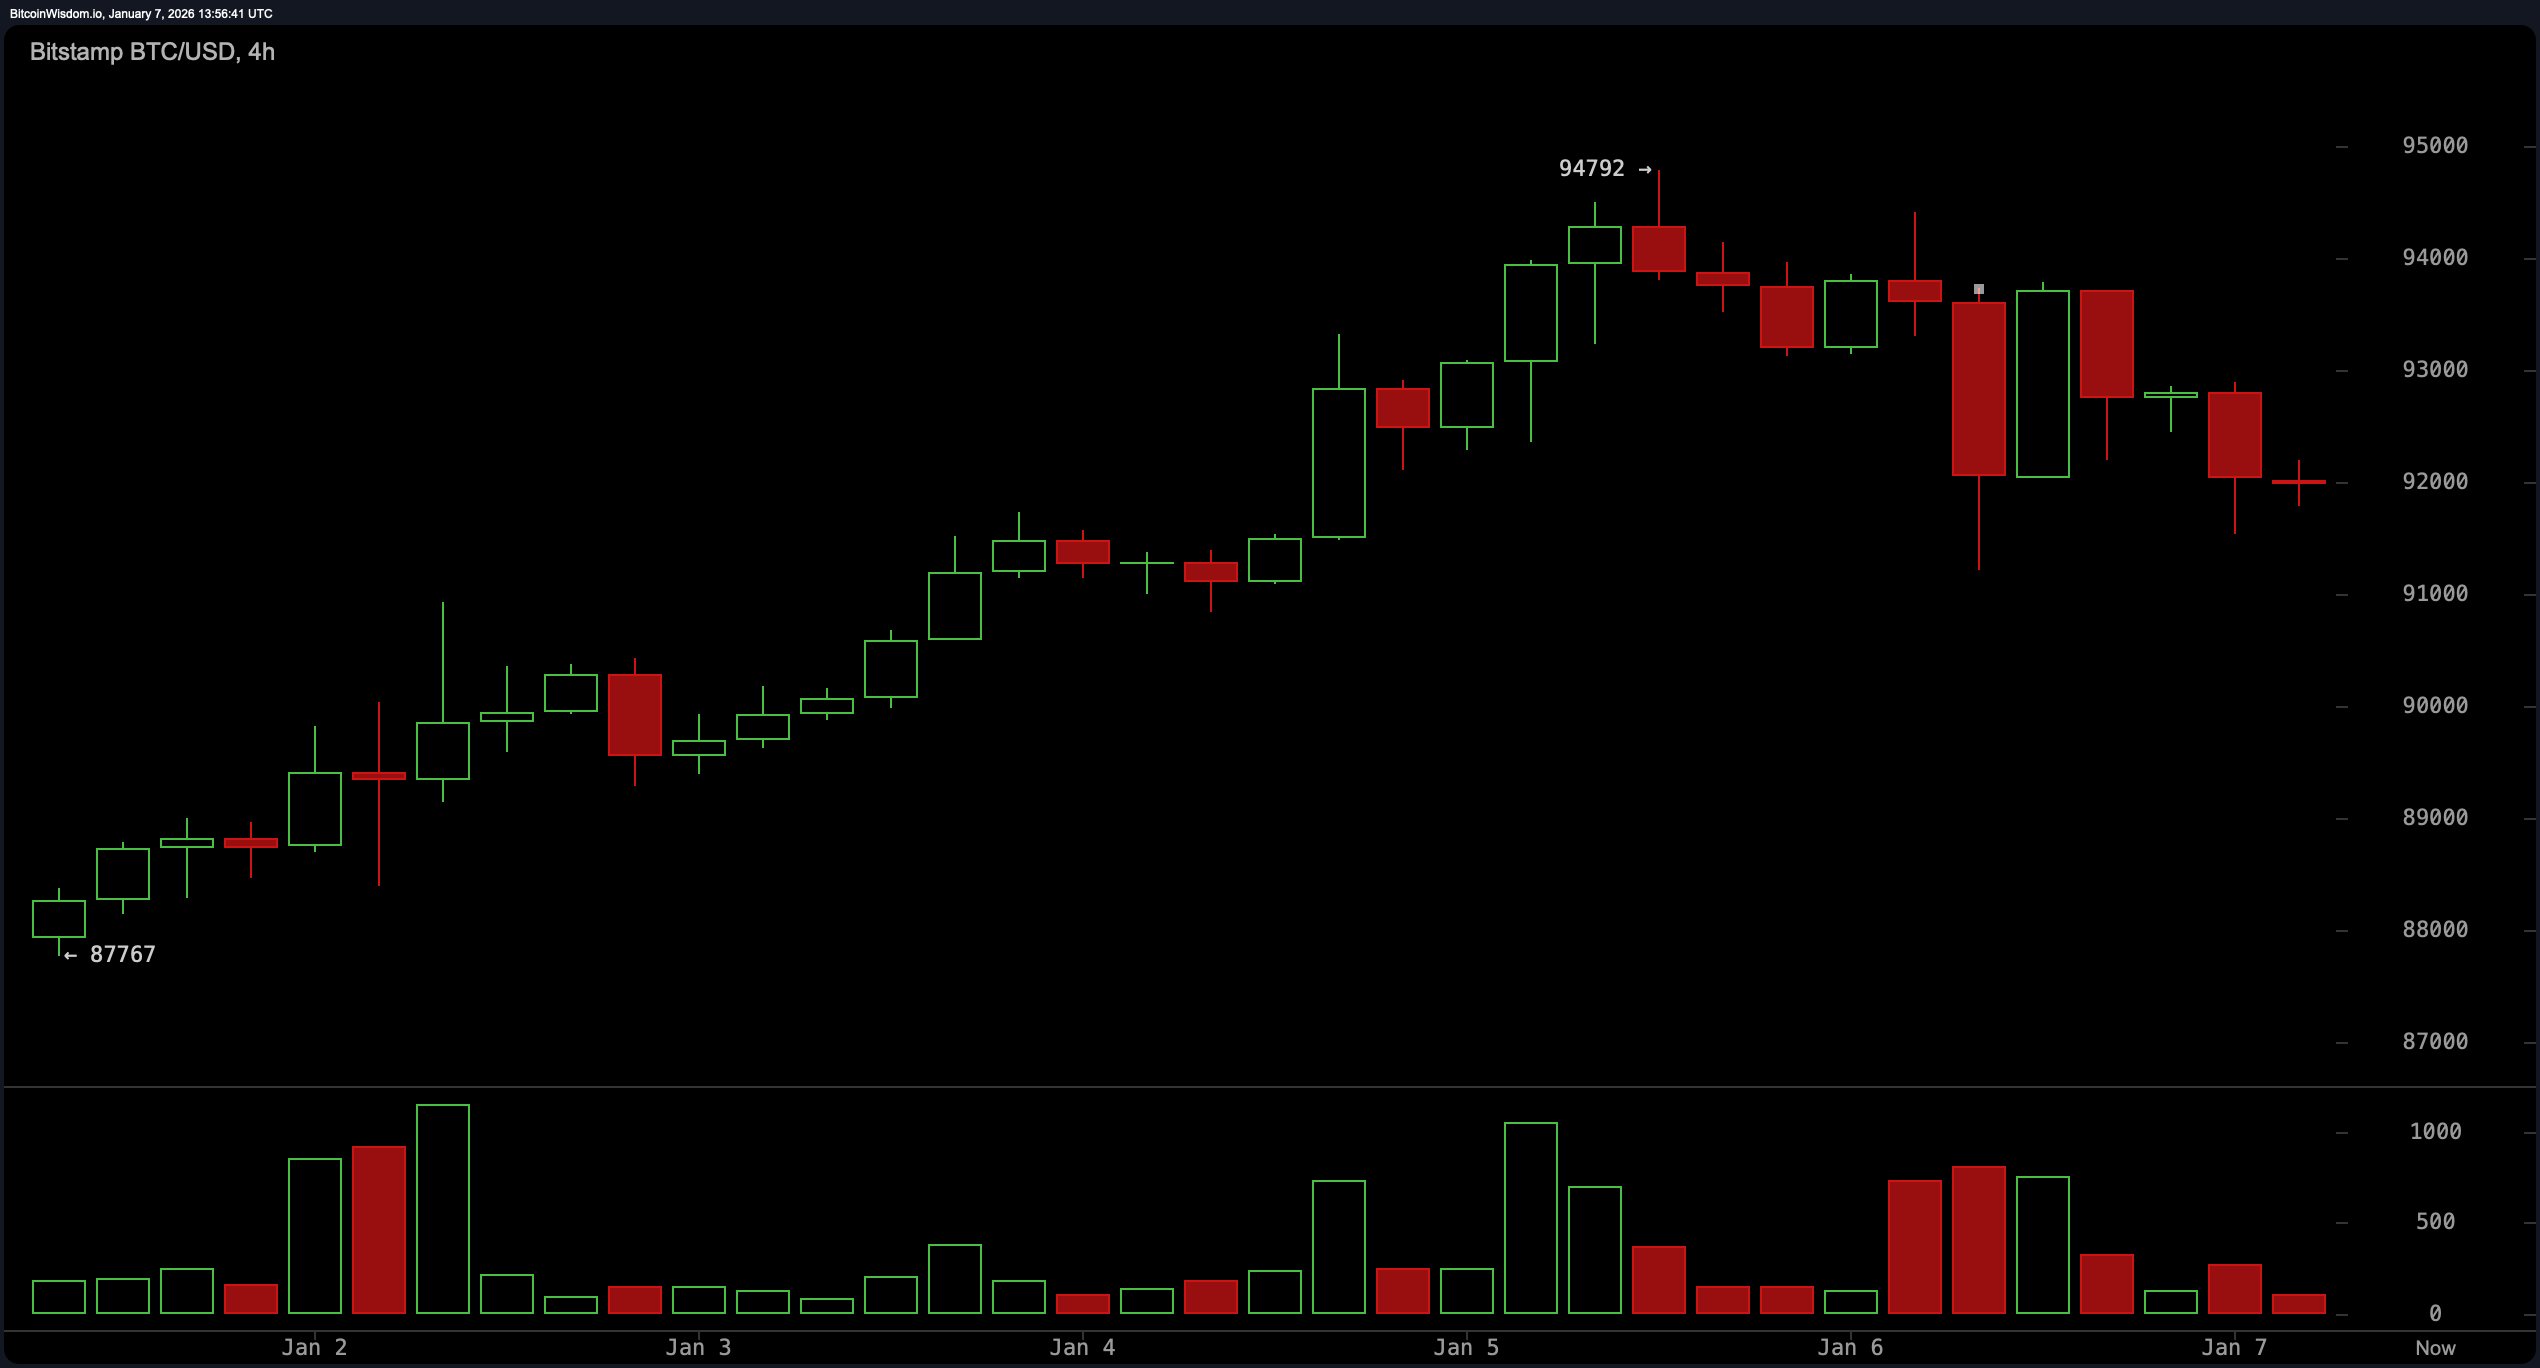
On shorter timeframes like the 4-hour chart analysis shows bearish tendencies dominating with lower highs and lower lows becoming apparent. After being rejected at nearly 94,792 dollars,the price has been declining steadily accompanied by increasing selling volume—a negative sign highlighting critical support between about 91,800 and 92,000 dollars.
The hourly chart depicts an uneasy calmness marked by sideways consolidation within the range of roughly 91,500 to 92,500 dollars, a sign that buyers are losing steam while sellers maintain control.
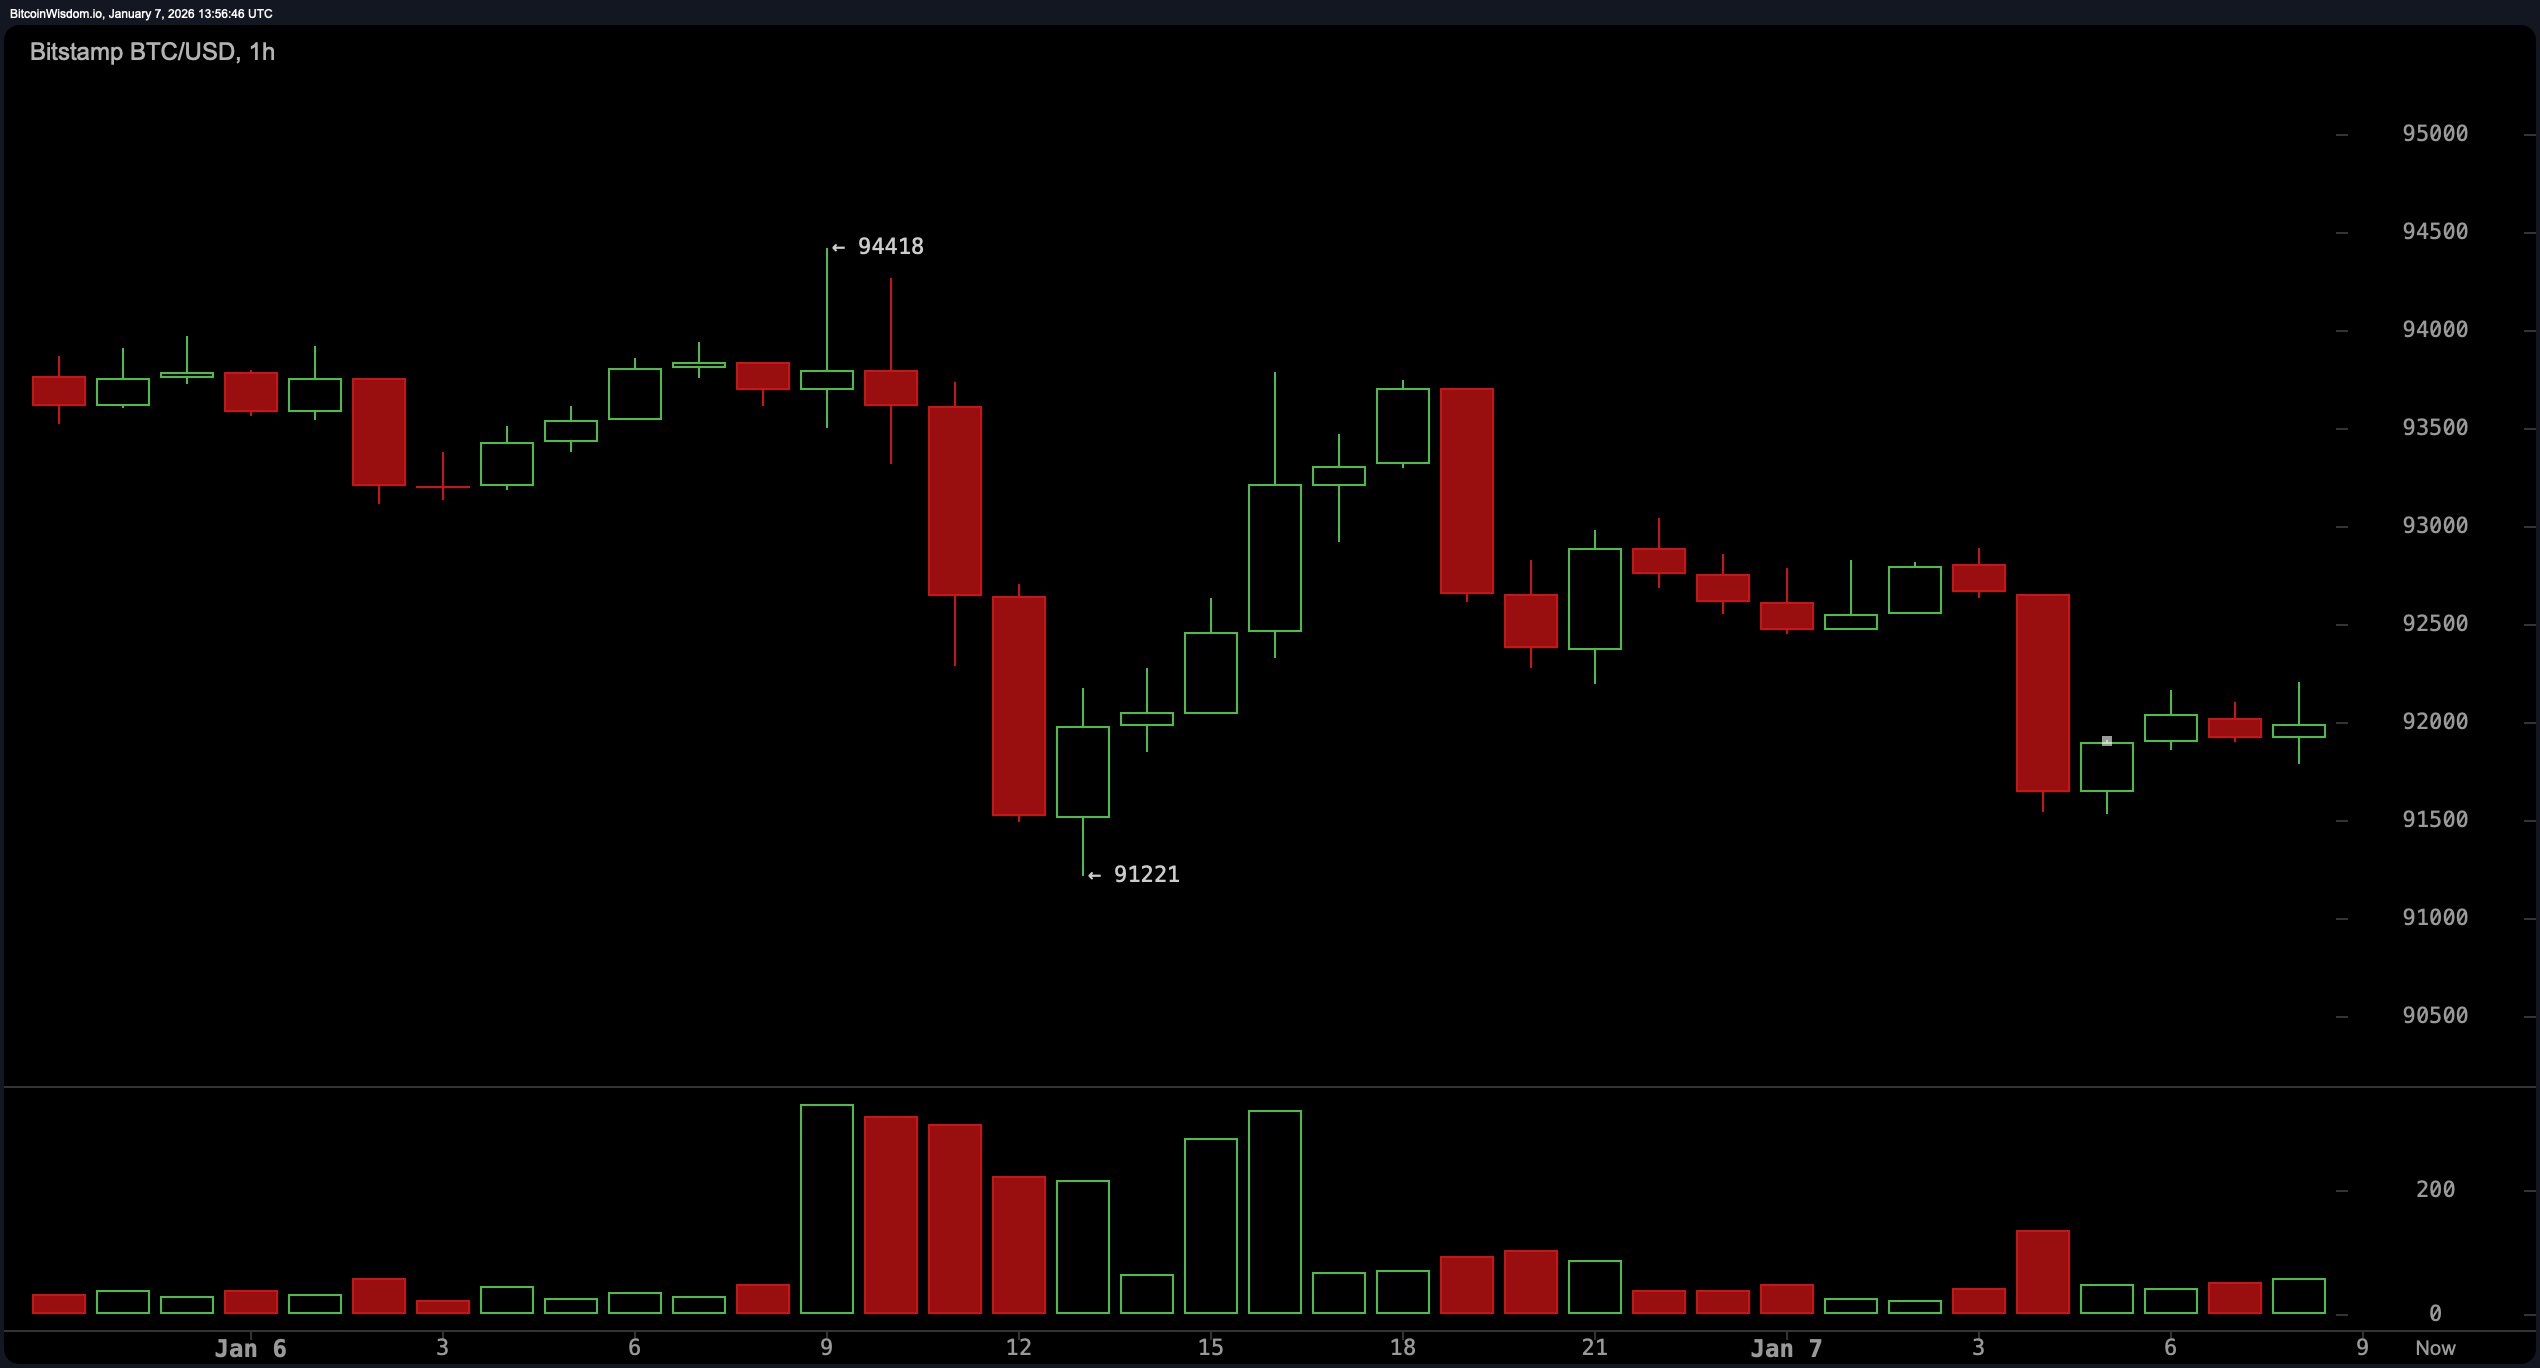
If prices break below the key support at about 91,500 dollars, a drop toward psychological support near $90,000.
will likely follow.
Conversely, if bulls manage to push above $93,, short-term optimism could briefly revive.
Diving into technical indicators offers mixed signals with some leaning bearish but others still hinting at potential strength:
- The Relative Strength Index (RSI) stands neutral around 57.
- The Stochastic oscillator signals overbought conditions near 81.
- The Commodity Channel Index (CCI) also indicates overextension with values close to 142.
- Momentum readings have weakened significantly down to approximately 4125, raising caution flags.
- The MACD remains slightly positive at about 667, suggesting faint bullish momentum amid broader weakness.
A look at moving averages reveals contrasting trends:
- The short-term exponential moving averages (EMAs) and simple moving averages (SMAs), including periods like 10 through 50 days, support ongoing upward movement.
- This contrasts sharply with longer-term EMAs &&; SMAs spanning periods such as100and200dayswhichcurrentlypointtowardbearishpressureandpotentialdownsideifbullsdon’tregaincontrolsoon.
Bullish Perspective:
If Bitcoin can maintain its footing above roughly$91,ȷ0;with substantial buying interest behind it,
the bulls may regain dominance.The next target would be breaking past$ᙥ.Thiswouldconfirmthattheuptrendisstillintactfornow.
m>p>
Bearish Outlook:
ifbitcoinfailsprotectionaroundthecriticalsupportlevelofapproximately&nbs p;$911500,the bearscouldseizecontrolwithdownside targetsat$90000andpossiblyaslowas$88000.Momentumfavorsthedowntrend,andwithoutafastreversal,thisdeclinemayacceleratequickly.
< ; h2 & gt ; Frequently Asked Questions ❓ < ; / h2 & gt ;
< ; p & gt ; What is bitcoin’s current trading range?< ; / p & gt ;
< span & gt ;
Bitcoin is presently fluctuating between $,91926,and $,92022 on January seventh ,2026 .
< / span > ;
< p> Where does bitcoin face resistance?< / p>
Resistance primarily lies in thespan>$94000to95000range.