Every few years, a specific chart pattern emerges in the Bitcoin market that captures significant attention due to its remarkable consistency across major US midterm election cycles since Bitcoin began trading.
The historical price trends of Bitcoin indicate that these corrections during election years typically occur towards the conclusion of substantial bull runs, eventually leading to another robust expansion phase. As we enter the 2026 midterm cycle with Bitcoin currently over 50% below its all-time high, the upcoming months may witness both a deeper correction and a more extensive long-term rally.
Bitcoin’s Relationship with Mid-Term Election Years
A recent analysis shared by crypto analyst Crypto Patel on social media platform X delved into how Bitcoin has reacted during previous US midterm election years, revealing a recurring price movement pattern. Notably, in each of the three completed midterm election years recorded so far, Bitcoin experienced significant losses.
The first instance occurred in 2014 when Bitcoin plummeted approximately 86% from its prior all-time high during that election year. A similar trend was observed in 2018 when another severe bear market saw Bitcoin decline around 84% from its peak.
This pattern reappeared in 2022 as well when Bitcoin fell roughly 77% from its previous cycle high. Each correction coincided with similar stages within the four-year market cycle aligned with US midterms. Historical data shows that each preceding cycle bottomed out one or two months after those elections took place.
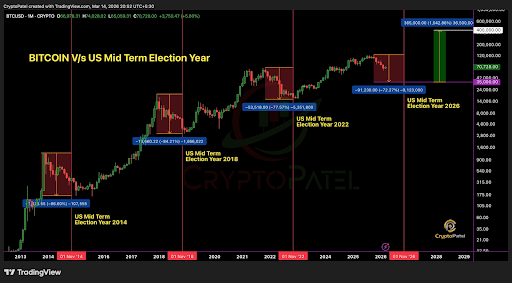
Bitcoin Price Chart. Source: @CryptoPatel On X
Implications for the Upcoming Cycle in 2026
Bitcoin reached its latest peak back in October 2025 and has since entered a notable corrective phase. Current pricing data indicates that Bitcoin is trading around $73,600—approximately 42% lower than this all-time high. The most significant drop thus far occurred in February when it briefly dipped to about $63,000—a decline of roughly 52% from its peak value.
If historical patterns related to electoral cycles repeat themselves similarly this time around, it’s possible for Bitcoin’s price to experience one final downturn before transitioning into an extended recovery phase.
The forecast provided by analyst Crypto Patel suggests potential lows could fall within the range of $35,000 to $40,000 between November 2026 and February 2027. However, what stands out more significantly within Crypto Patel’s analysis is not just this projected decrease but rather what might ensue afterward.
An examination of past price movements following previous US midterm elections reveals that on average; there was about a **54%** rally before experiencing minor pullbacks—these were subsequently followed by stronger rallies pushing prices toward new highs ahead of subsequent electoral cycles. Based on this historical context; it’s conceivable that after the upcoming **2026** midterms; we could see **Bitcoin’s** price soar beyond **$400k** over time.
Featured image sourced from Dall.E; chart credited to TradingView.com