Bitcoin is striving to regain stability after a sharp decline from the $89,500 level. Although it has found some temporary support, current market behavior suggests this rebound might be more of a pause than a full recovery.
Bitcoin Price Analysis
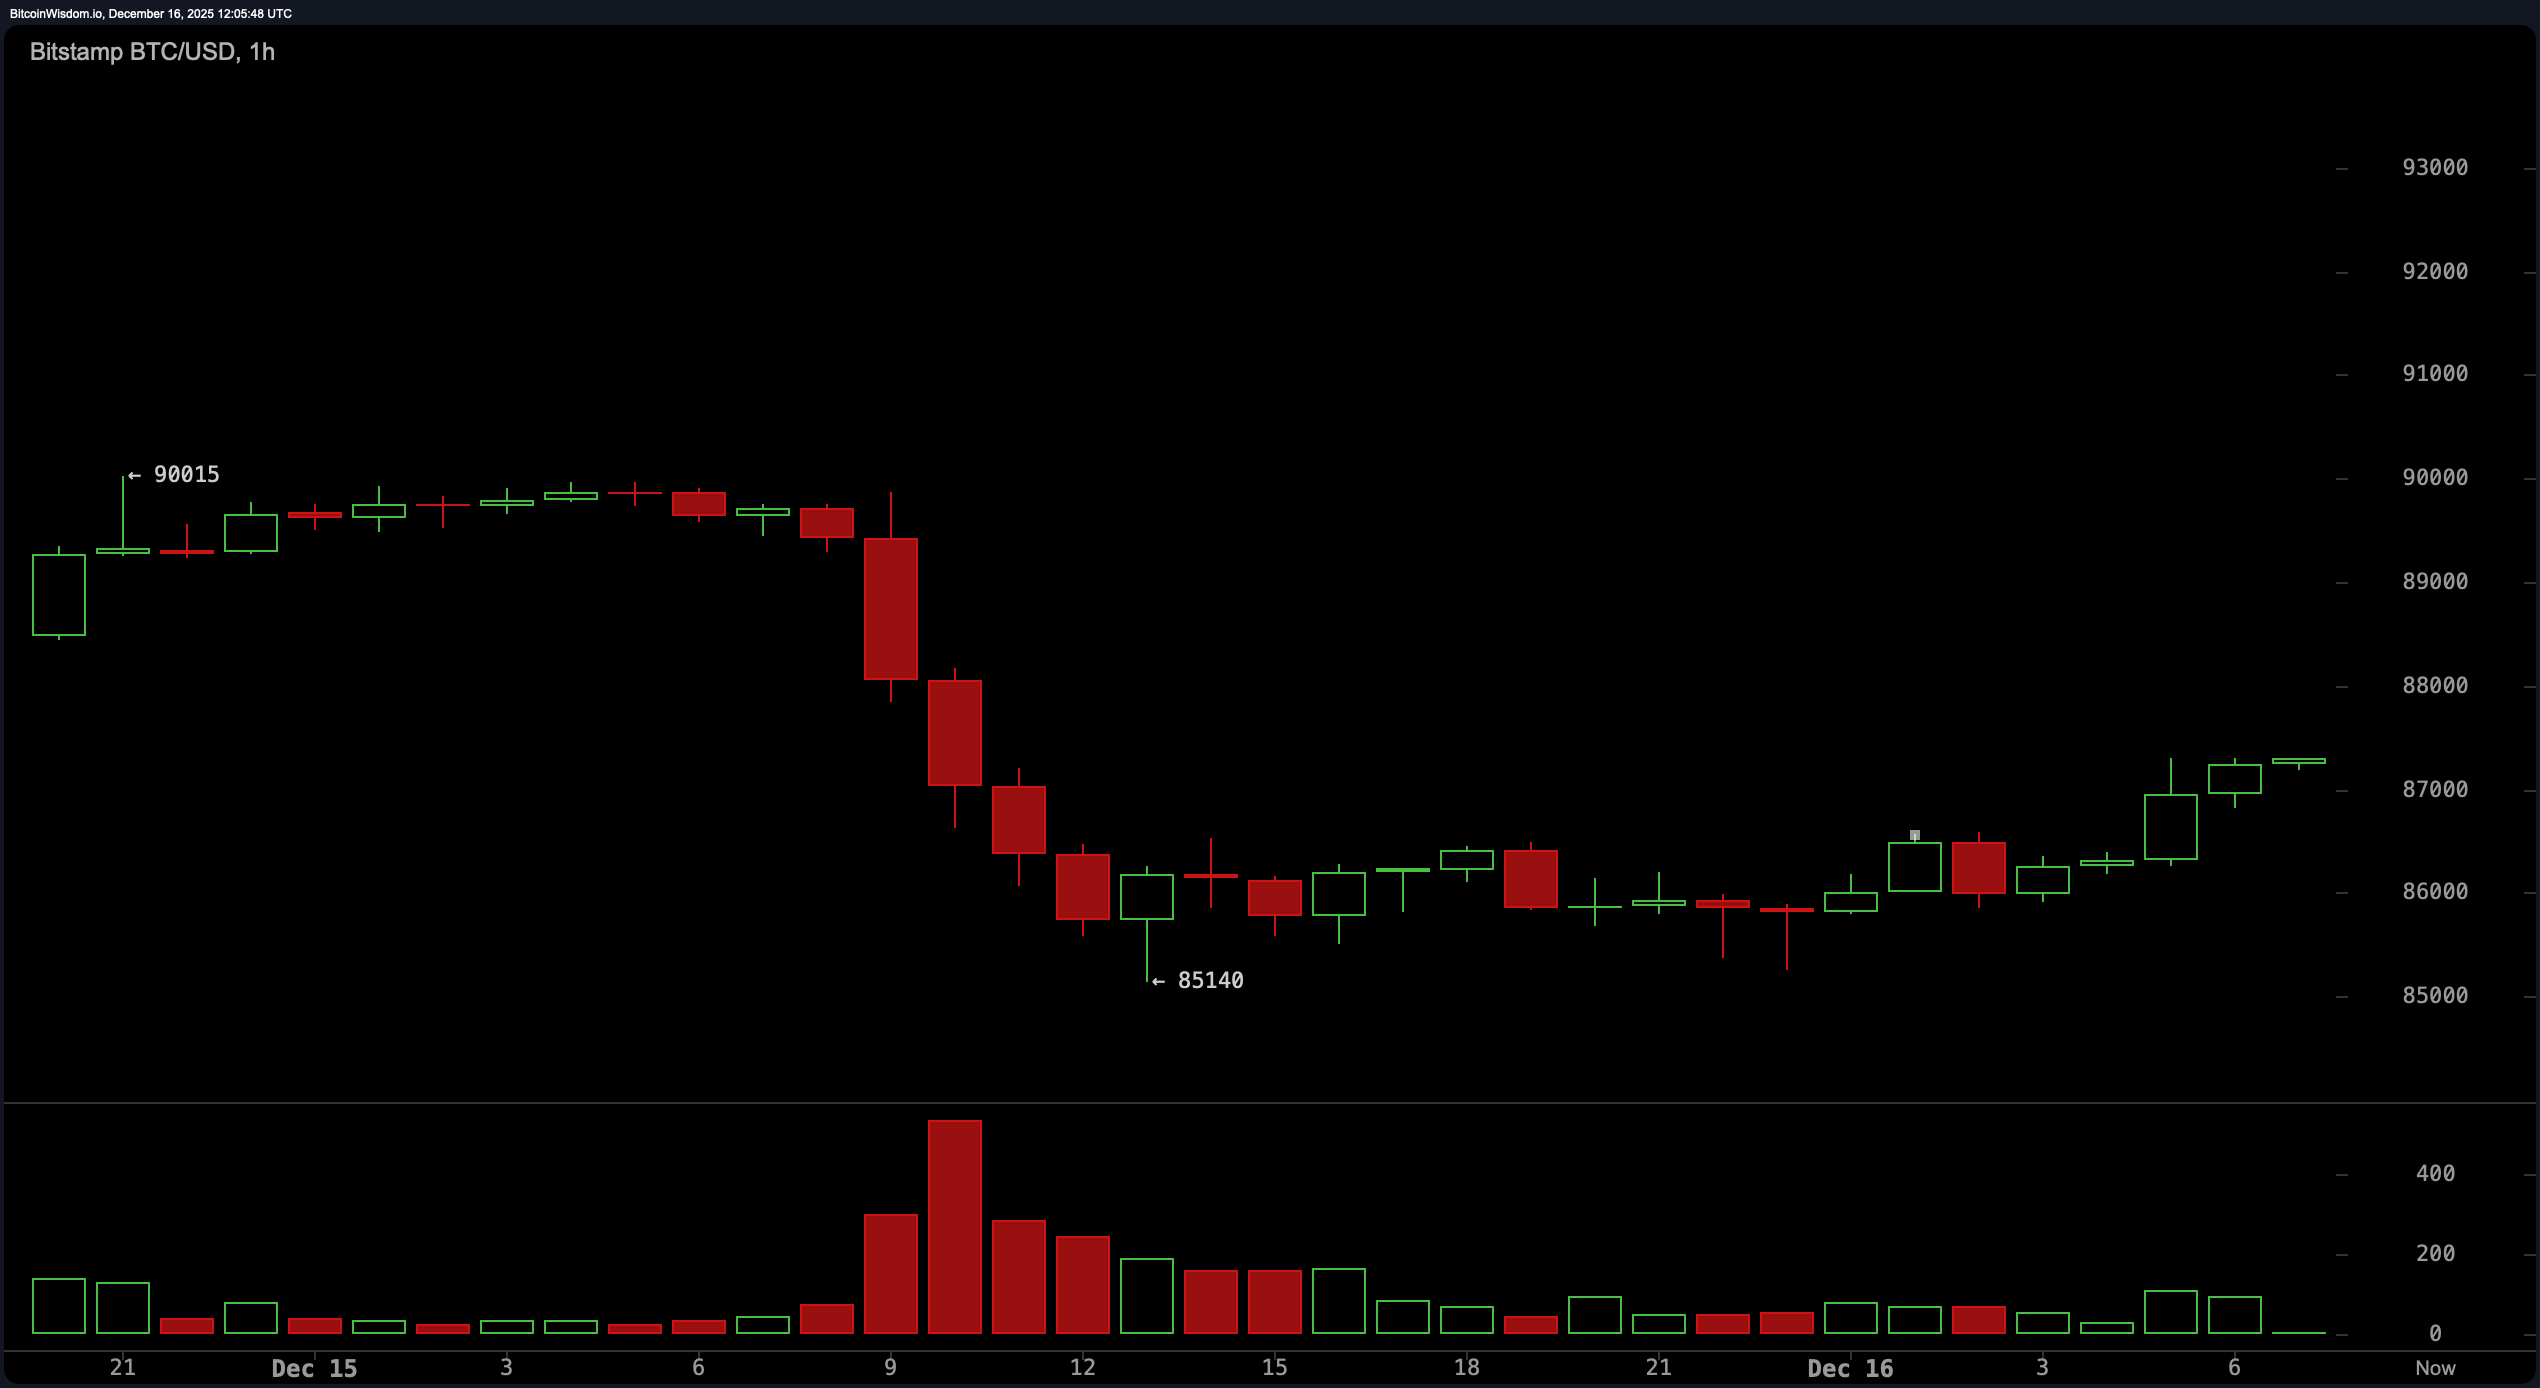
Examining the one-hour chart reveals that Bitcoin dropped from near $90,000 down to about $85,000 before attempting to recover. The price action resembles a bear flag pattern—a typical sign of weak recovery characterized by low trading volume and limited buying enthusiasm.
The green candlesticks show little momentum behind them, implying buyers are hesitant rather than confident. Unless there is a strong breakout above $88,500 accompanied by high volume and confirmation on the four-hour chart, further declines seem probable.
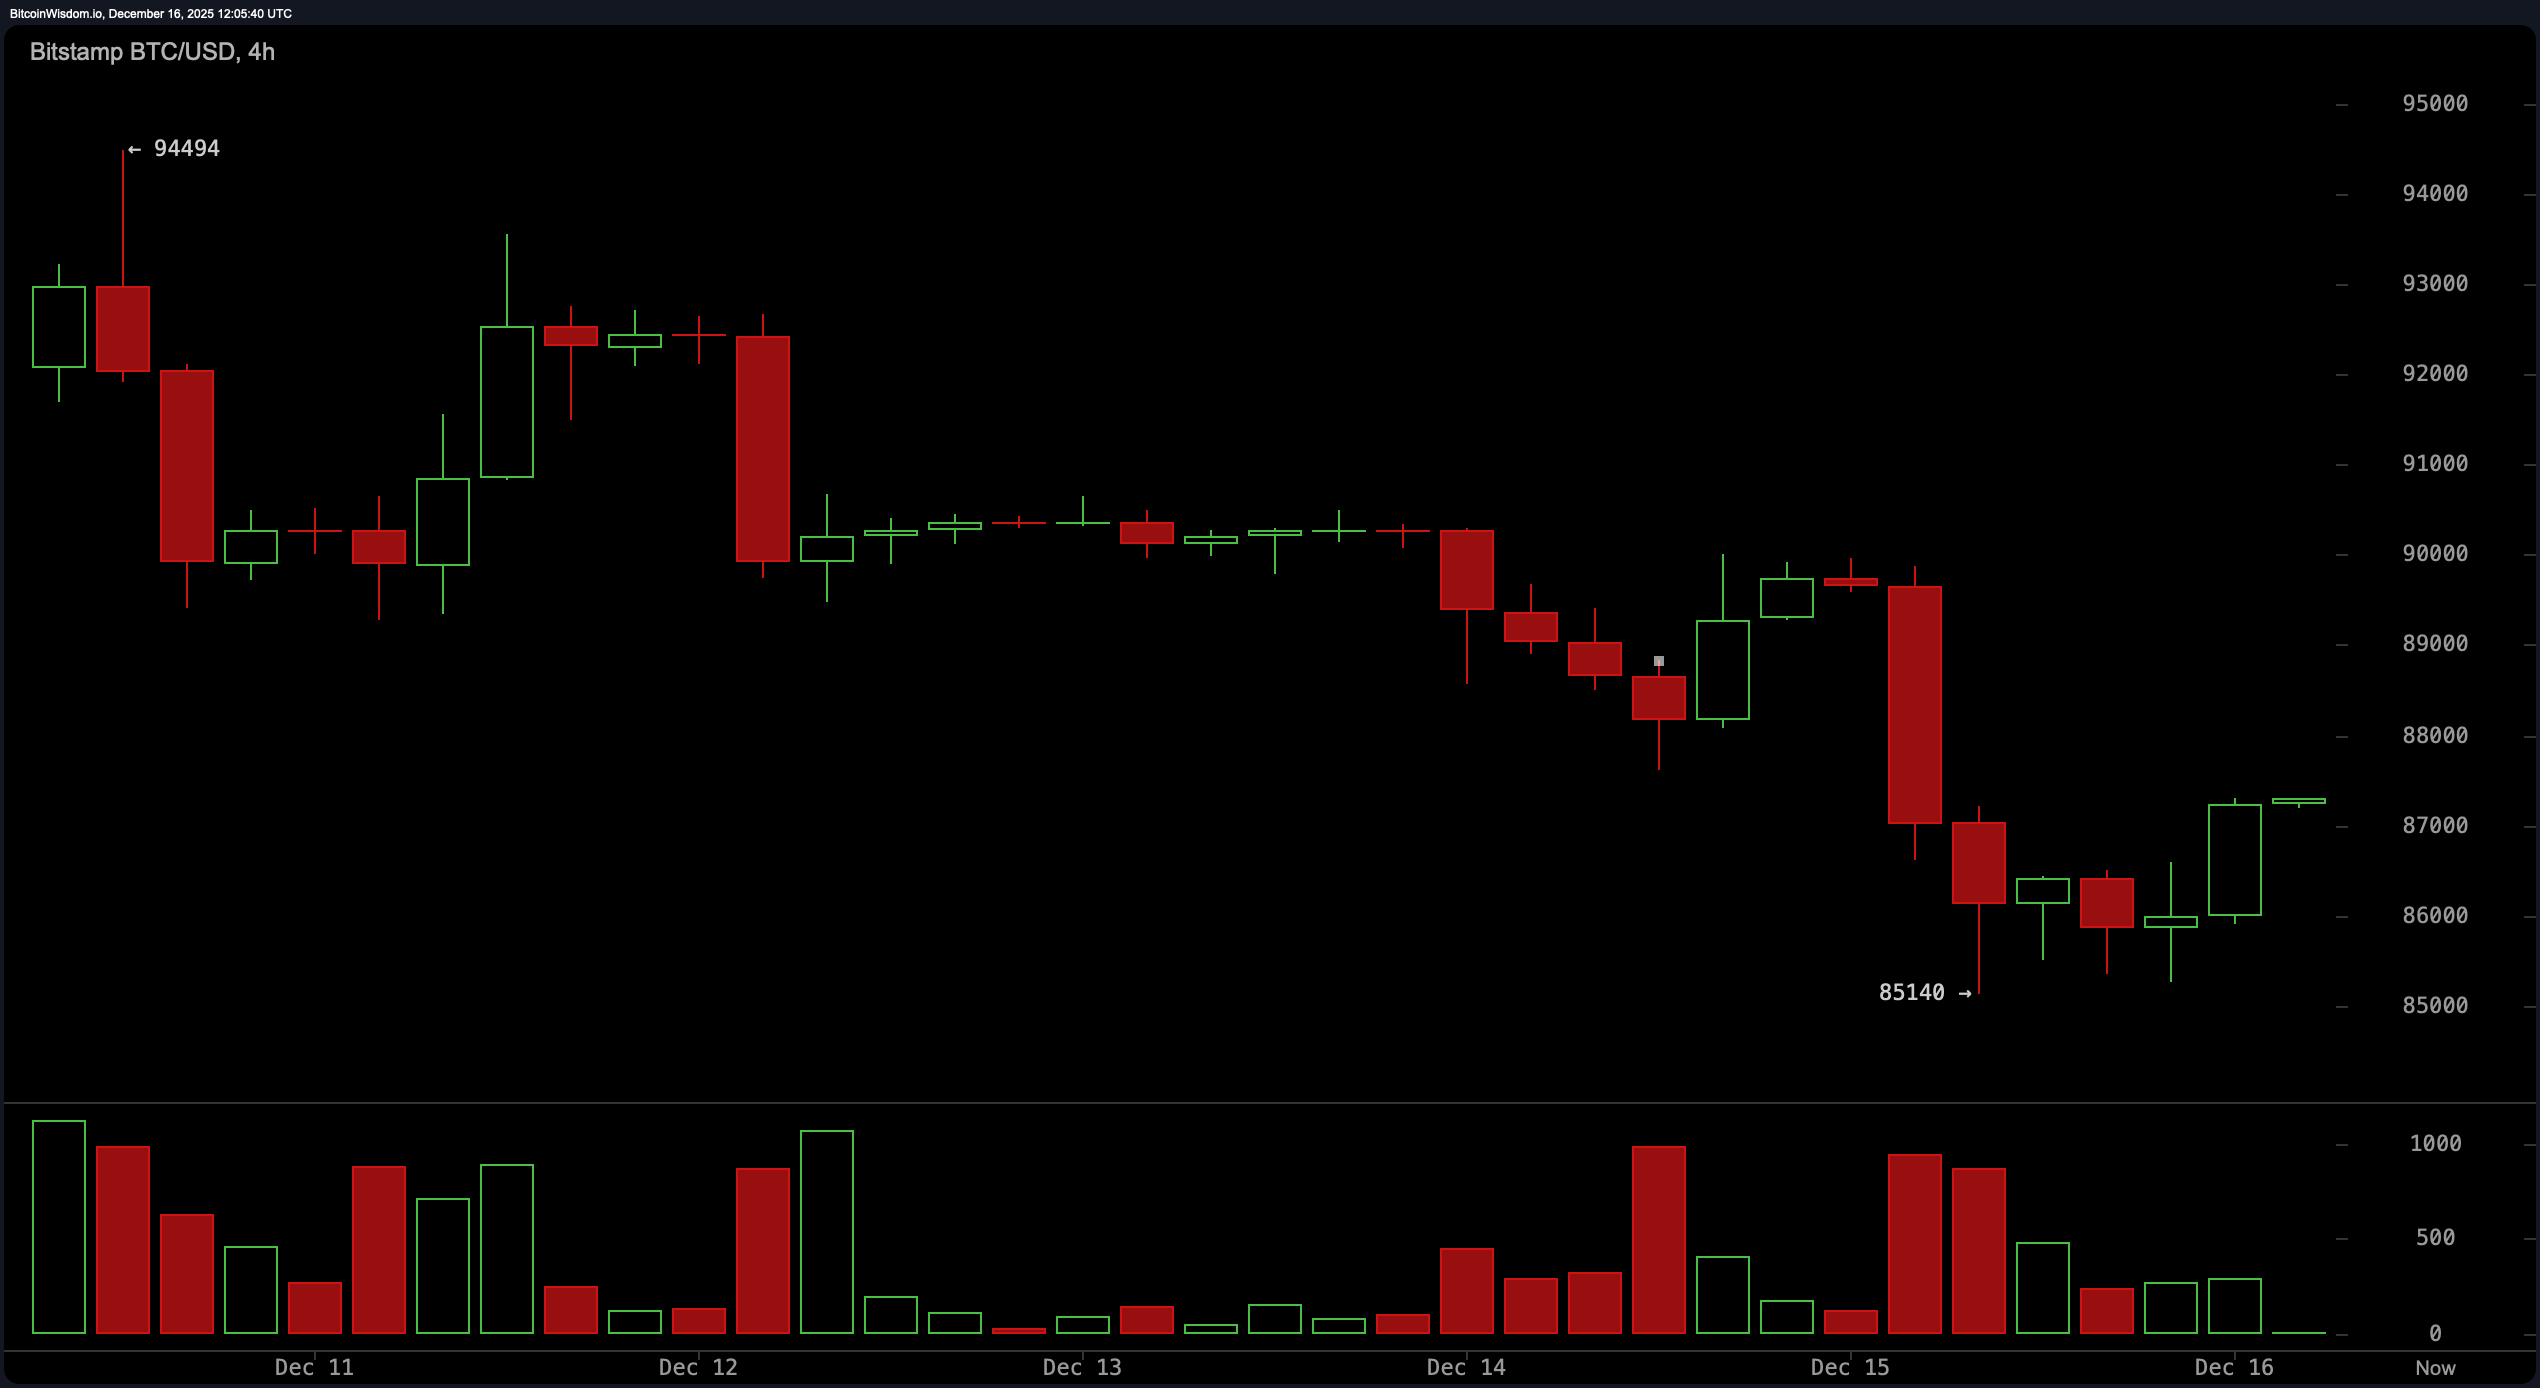
Looking at the four-hour timeframe, Bitcoin experienced a modest rally from around $85,000 up toward the resistance zone between $87,500 and $88,000. However, this bounce lacks strength as sellers are expected to reemerge near resistance levels ranging from $88,000 to $89,000.
The volume profile shows an earlier capitulation sell-off followed by this subdued recovery—classic signs that the market is consolidating within an ongoing downtrend rather than reversing it. Should prices fall below approximately $86,000 again during this phase of consolidation more downside pressure may follow.
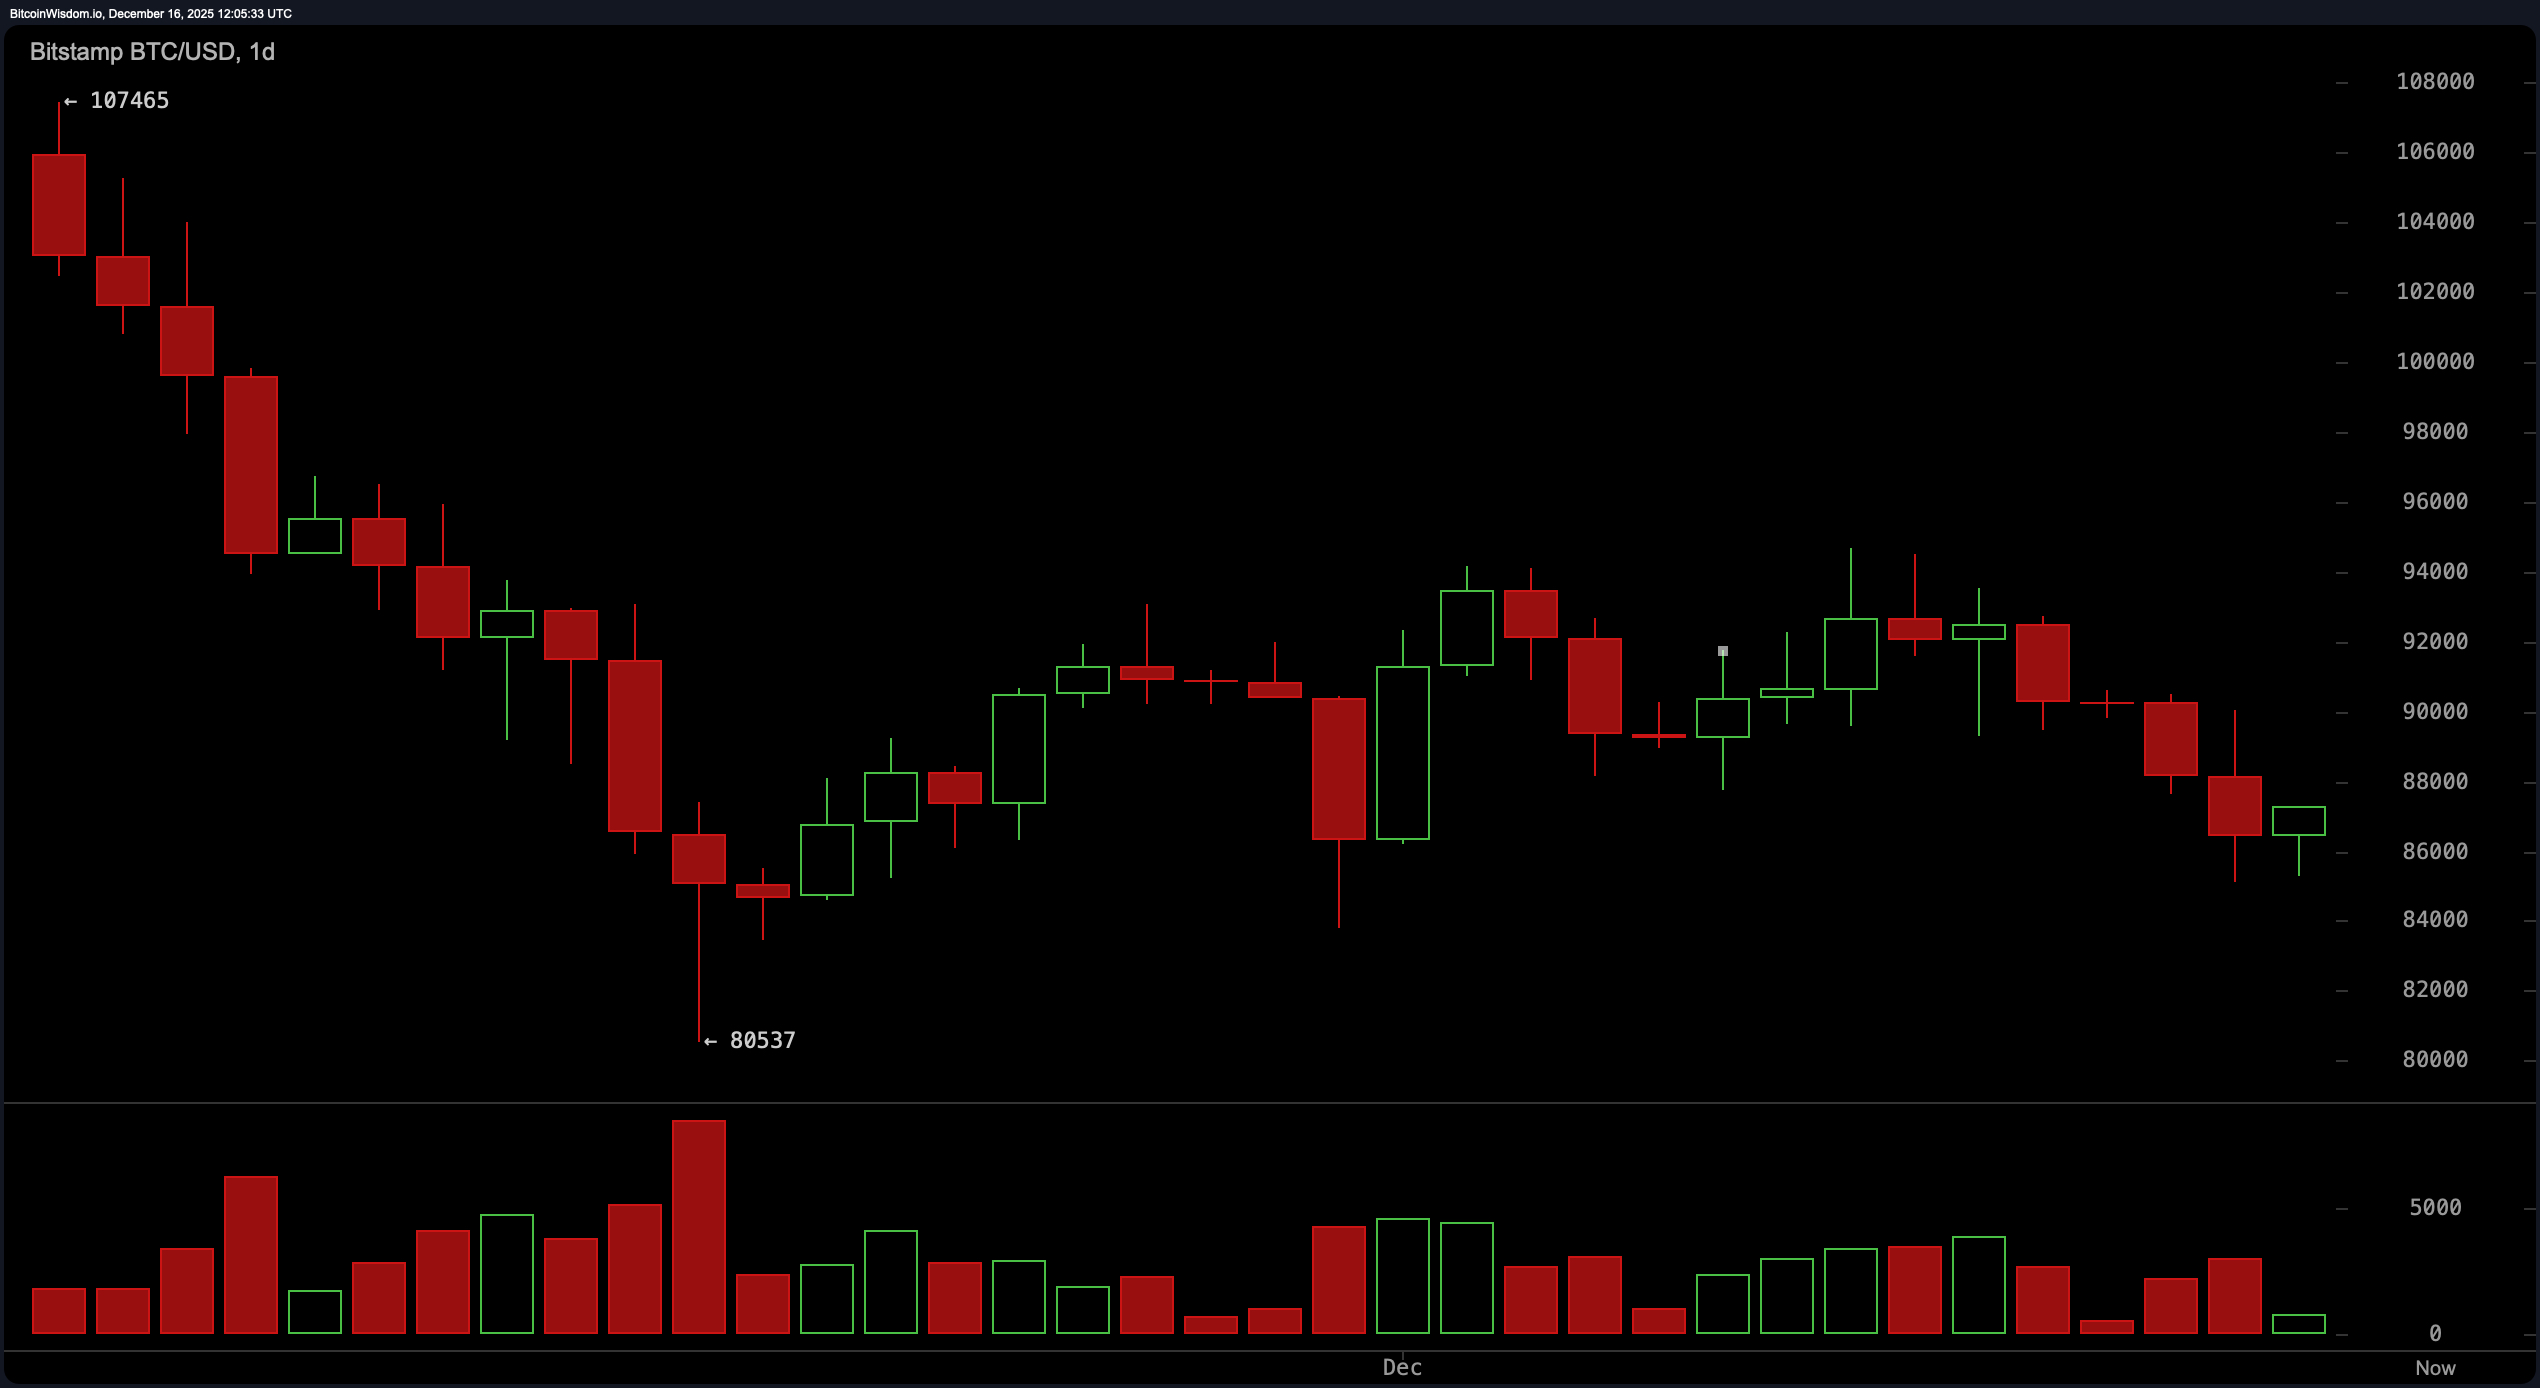
On daily charts spanning several weeks or months we observe an overarching downward trend moving from highs near $107K down toward roughly $80K. While there was some relief rallying activity recently visible in green candles on lighter volumes—the move appears fragile and lacks conviction for sustained bullish momentum.
The critical support zone lies close to about $80,&$500 while key resistance ranges between roughly $94,&$95 thousand remain intact without any decisive breakouts yet observed on daily closes with meaningful volumes indicating genuine trend reversal potential.
Technical indicators present mixed signals across different timeframes:
- The Relative Strength Index (RSI) stands around 40 suggesting neutral momentum;
- The Stochastic Oscillator reads approximately 25 indicating no clear directional bias;
- The Commodity Channel Index (CCI) sits near −177 also pointing towards neutrality;
- The Average Directional Index (ADX) measures about 27 confirming lackluster trend strength;
- Amazing Oscillator & Momentum values lean slightly bullish but remain cautious amid overall weakness;
- MOVING AVERAGE CONVERGENCE DIVERGENCE (MACD) levels similarly hint at tentative upside potential but need confirmation through price action changes.
No moving averages currently provide support since both exponential moving averages (EMAs) and simple moving averages (SMAs), ranging from short-term periods like 10 up through long-term spans such as 200 days sit well above current prices signaling bearish dominance remains firmly in place:
- EMA(10): ~$89,&$272
- SMA(10): ~$90,&$069
- EMA(200): ~$102,&$872
- SMA(200): ~$108,&$389
Summary:
Bitcoin’s recent attempt at bouncing back should be approached cautiously until it decisively breaks past strong resistance near $94K with solid trading volumes backing such moves.
For now,the market remains vulnerable with uncertainty prevailing so traders should avoid chasing volatile price swings prematurely.
Bullish Perspective:
If Bitcoin manages a convincing daily close above $94,$00 supported by robust volume figures,it could signal an end to bearish patterns like bear flags,reclaim important moving average territories,and potentially pave way for mid-term rallies targeting beyond six-figure territory ($100k+).
Momentum indicators including MACD already hint early signs of strengthening,but confirmation depends heavily upon actual price performance going forward.
Bearish Outlook:
If prices fail maintaining crucial supports around $86,$00 or slip below critical floors near $85,$00,the continuation of downward trends becomes increasingly likely.
Moving averages stacked overhead act like heavy ceilings limiting upward progress while weak volumes reinforce lackluster buyer interest.
In such cases,a retest toward lows closer to~$80,$5k or even lower cannot be ruled out—and indeed looks probable based on current technical conditions. 
🐻️ FAQ
<b>Where does bitcoin trade right now?
Currently priced around $87&comma263 ,bitcoin holds a market capitalization approximating $1&period74 trillion.
<b>What's bitcoin's short-term trajectory?
Chart patterns suggest bearish tendencies marked by feeble attempts at upward movement.
<b>Which key levels should traders monitor?
Support hovers close to $85&comma000&comma while resistance clusters between $94&comma000&period
</P >
<b&GTIs now an opportune moment for entering bitcoin markets?</b&GT<BR/>
Given mixed technical signals combined with ongoing volatility,this period demands caution rather than aggressive entry strategies&period
</P&GT