Rekt Capital, a prominent figure in the cryptocurrency analysis community, has provided significant insights regarding the technical landscape and potential developments following Bitcoin’s recent surge.
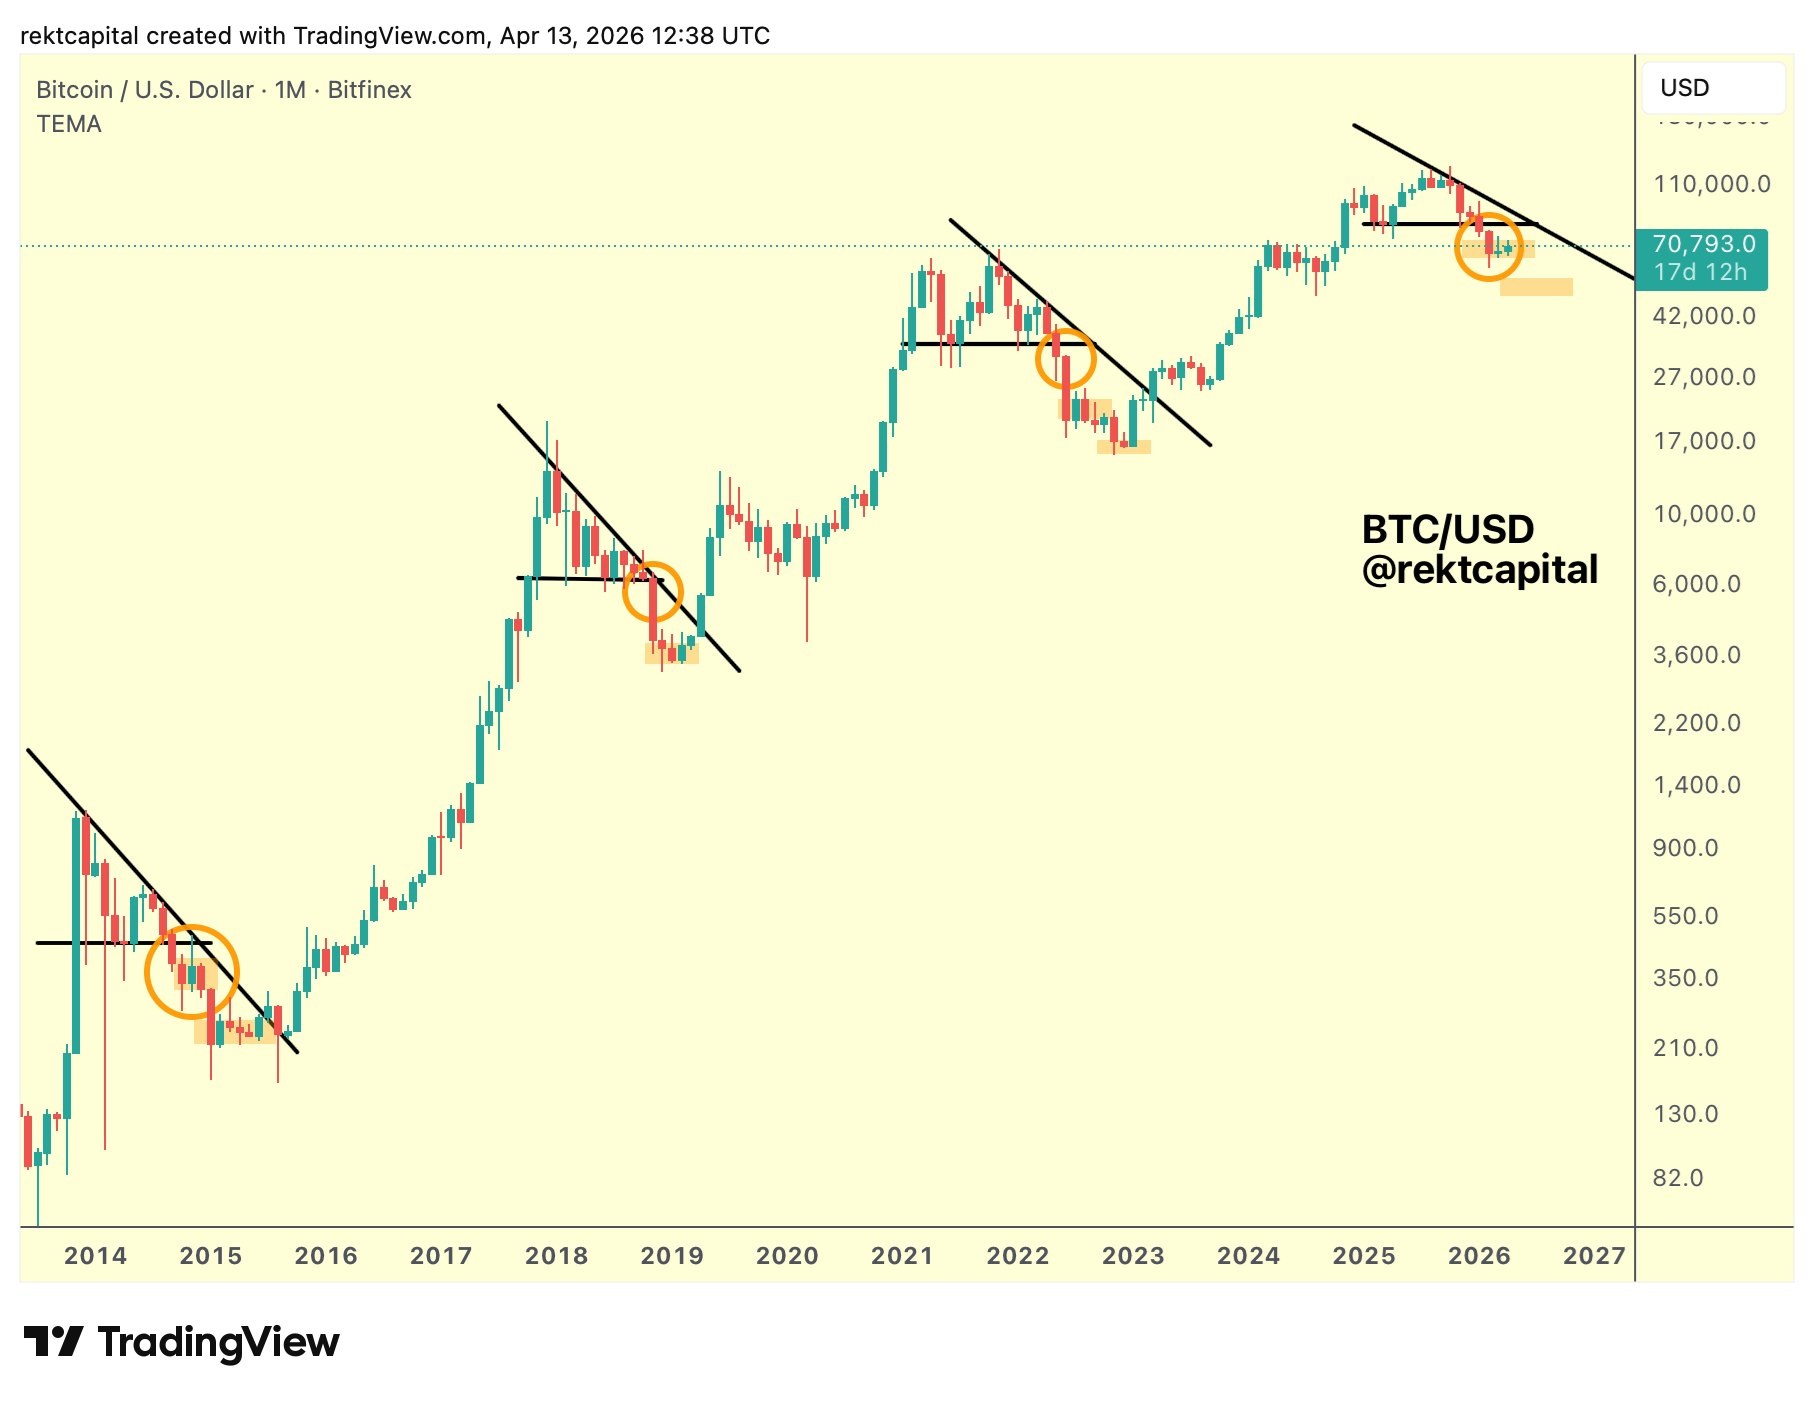
The analyst notes that historically, when Bitcoin breaks down from “Macro Triangle” patterns during previous cycles, it typically retraces towards the lows associated with bear markets over time. However, each cycle exhibits unique characteristics in how this unfolds. Rekt Capital highlights that past breakouts in 2018 and 2022 led to swift and steep price declines; yet he observes that the current cycle is behaving differently.
He draws parallels between the present price action and that of 2014. During this earlier phase, Bitcoin underwent an extended period of sideways movement beneath its triangle formation. The analyst posits that if a similar trend persists now, we may see Bitcoin trading laterally for some time with around $82,500 serving as a formidable resistance level (upper boundary).
Related News Why Did the Bitcoin Price Go Up? Three Experts Explain the Reasons
The analyst further explains that after macro triangle breakouts, Bitcoin usually establishes substantial consolidation zones. Reflecting on previous cycles from 2018 and 2022 where these consolidations occurred right at bear market bottoms, Rekt Capital points out an interesting pattern from 2014: two distinct consolidation phases emerged—one immediately following the breakout and another at what turned out to be the ultimate bottom.
If this historical trend holds true again today, he suggests it’s possible we have not yet reached completion of our current consolidation phase. This implies there could still be room for further downward movement in Bitcoin’s price before establishing a major consolidation zone closer to bear market lows.
*This does not constitute investment advice.