
Egrag Crypto, a prominent crypto analyst, recently predicted that just a small blip could push Bitcoin higher based on its historical behavior.
Note that Bitcoin is still struggling just above the $121,000 mark, after dropping from the new all-time high above $126,000. The week has seen the largest crypto by market cap swing between $115,000 and $125,000. However, with the current price at $121,929, and with bullish predictions still active, the future looks bright for Bitcoin.
Notably, one of the bullish predictions emerged on X today, as analyst Egrag Crypto assessed Bitcoin’s historical behaviour on a 3-month timeframe. According to his analysis, Bitcoin has repeated a clear channel formation in the last three cycles.
However, around January 2013, Bitcoin experienced a breakout from the lower channel support, rallying to hit the $1,163 by November 2013, after which it witnessed a rejection. This marked a massive jump from the $11 price in July 2011.
Another notable breakout in Bitcoin’s history occurred in 2017. Notably, after trading within a channel from 2015 to early 2017, Bitcoin began to break through its resistance trendline. This breakout led to a parabolic rise, pushing Bitcoin’s price from the breakout price at approximately $1,500 to trade above $19,000 by October 2017.
Meanwhile, the third breakout occurred after Bitcoin’s price fell from the October 2017 levels to settle just above $3,000 in early 2019.
Following this drop, Bitcoin traded in another channel between $3,000 and $14,000 from 2018 to 2020. However, in October 2020, it broke out of this third channel, and by November 2021, the price surged past $69,000.
Bitcoin to $175,000?
The most recent channel formation started forming in April 2022 right after Bitcoin dropped from the October 2021 peak. This channel has been preventing Bitcoin from breaking both resistance and support to date, prompting the analyst to suggest an upcoming surge towards the upper trendline.
The chart shows that the returns keep diminishing. However, Egrag Crypto believes these are necessary for a more sustainable price growth. In his commentary, the analyst suggests that even a small price movement (“blip”) in this current cycle could push Bitcoin to $175,000.
He further explained that the middle of the price channel could see Bitcoin around $250,000, with the upper end potentially reaching $400,000. He believes these price targets are well within reach, drawing a parallel to his previous gold price target, which was set at $3,500 and is now trading around $4,000.
While acknowledging the possibility of a “Suckers Rally,” a temporary price surge that could mislead investors, he maintains that $175,000 is his primary target for Bitcoin. For context, Bitcoin would need to surge by approximately 42.7% from $122,622 to reach $175,000.
Further Bullish Prediction
It is important to note that there still exists other bullish predictions for the firstborn cryptocurrency. On his hand, Merlijn The Trader is eyeing a signal from Bitcoin’s MACD indicator, suggesting that a new price surge could be imminent. He noted that each time the MACD line has crossed in the past, Bitcoin has experienced a substantial price increase.
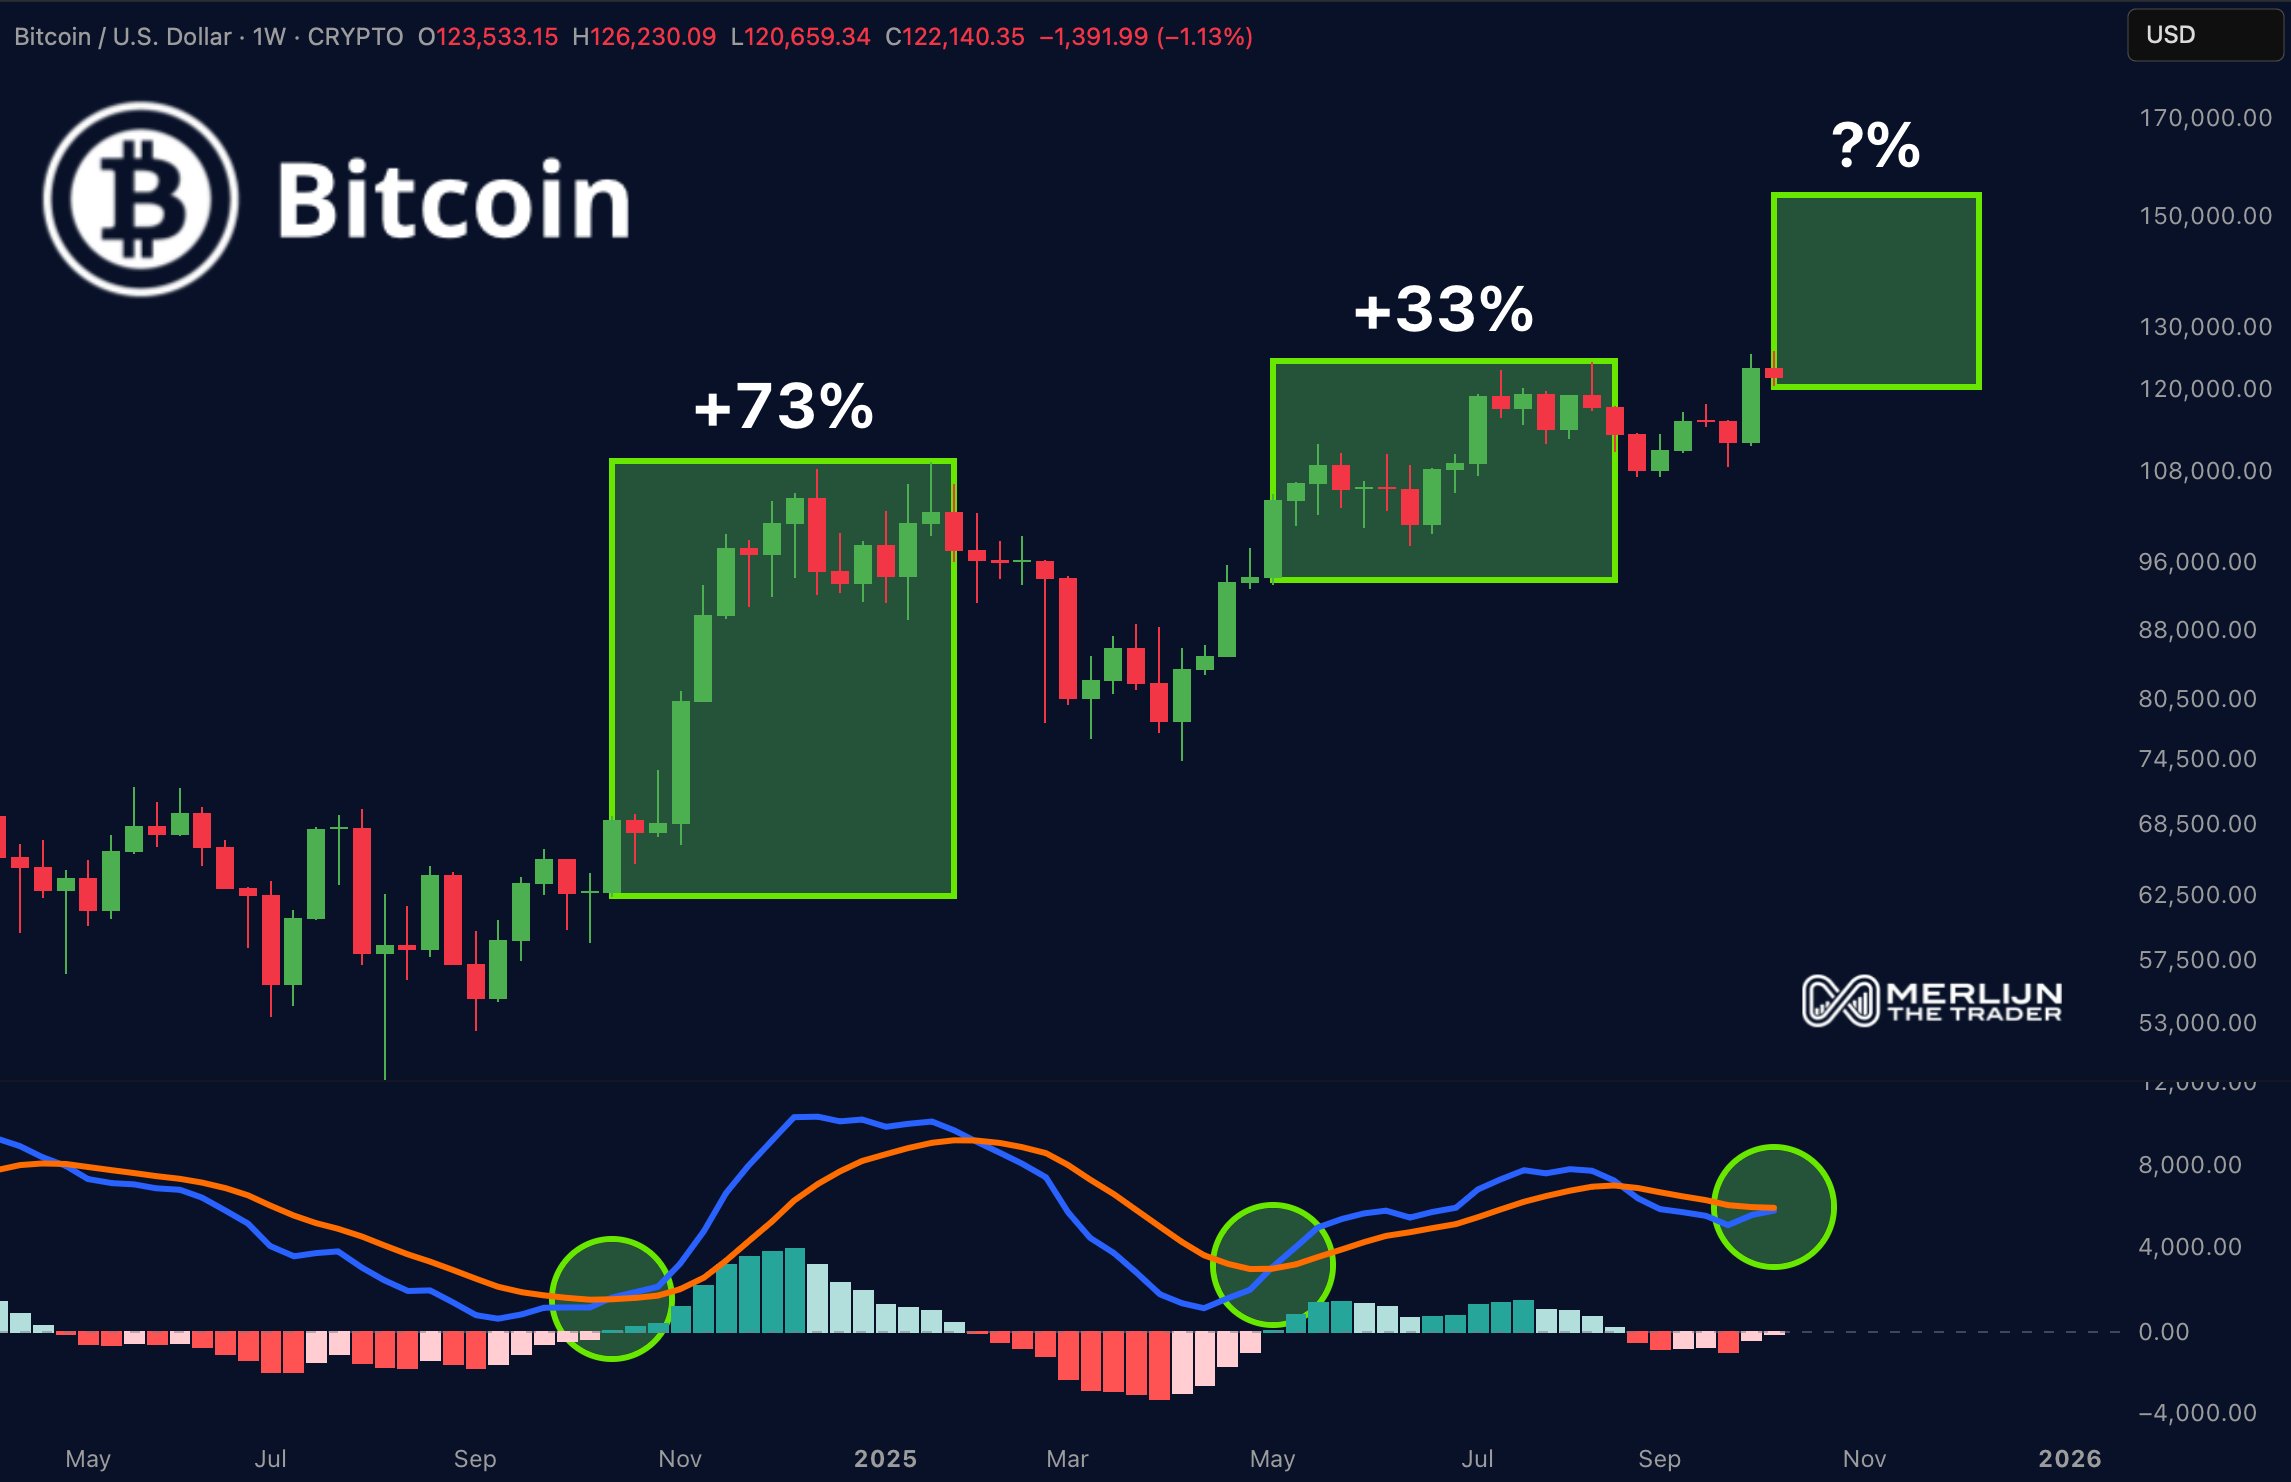
Bitcoin 1W Chart | Merlijn
This pattern is being repeated now, as the MACD has flashed again, which the trader believes could indicate another explosive phase for Bitcoin. Merlijn emphasized that this recurring pattern precedes every major price rally, implying that history might be about to repeat itself. Per the chart, the anticipated target is above $150,000.