
Bitcoin is currently facing challenges in its attempt to surpass the $70,000 mark. The price trends are not particularly encouraging. However, on a different note, long-term investors with a proven track record are increasingly purchasing Bitcoin at a pace not seen in several months.
A recent report from CryptoQuant highlights an interesting divergence between current price movements and the actions of dedicated market participants. There has been a notable increase in demand from accumulator addresses—wallets that exclusively receive Bitcoin without sending it out—which indicates strong long-term holding confidence. In contrast, the spot price has yet to return to its previous significant highs. This discrepancy suggests that two key metrics are moving in opposite directions.
This divergence serves as an important signal. When long-term wallets actively absorb supply while prices remain low, it implies that sellers may be quietly depleting their available supply without concern for present pricing levels. Instead, these investors seem focused on future valuations and are acting more swiftly than what current market conditions suggest.
The $70,000 threshold appears to act as resistance; however, data from accumulators paints a different picture—one where patient capital views this level as worth the risk for investment.
The Signal Is Valid; Confirmation Is Still Pending
The report clearly outlines what this accumulator divergence signifies—and just as importantly—what it does not imply. An uptick in demand from long-term wallets while prices linger below prior highs indicates positive structural development but does not constitute a breakout signal by itself. Rather, it’s an essential precursor for one; distinguishing between these two scenarios is crucial since many traders often make costly errors here.
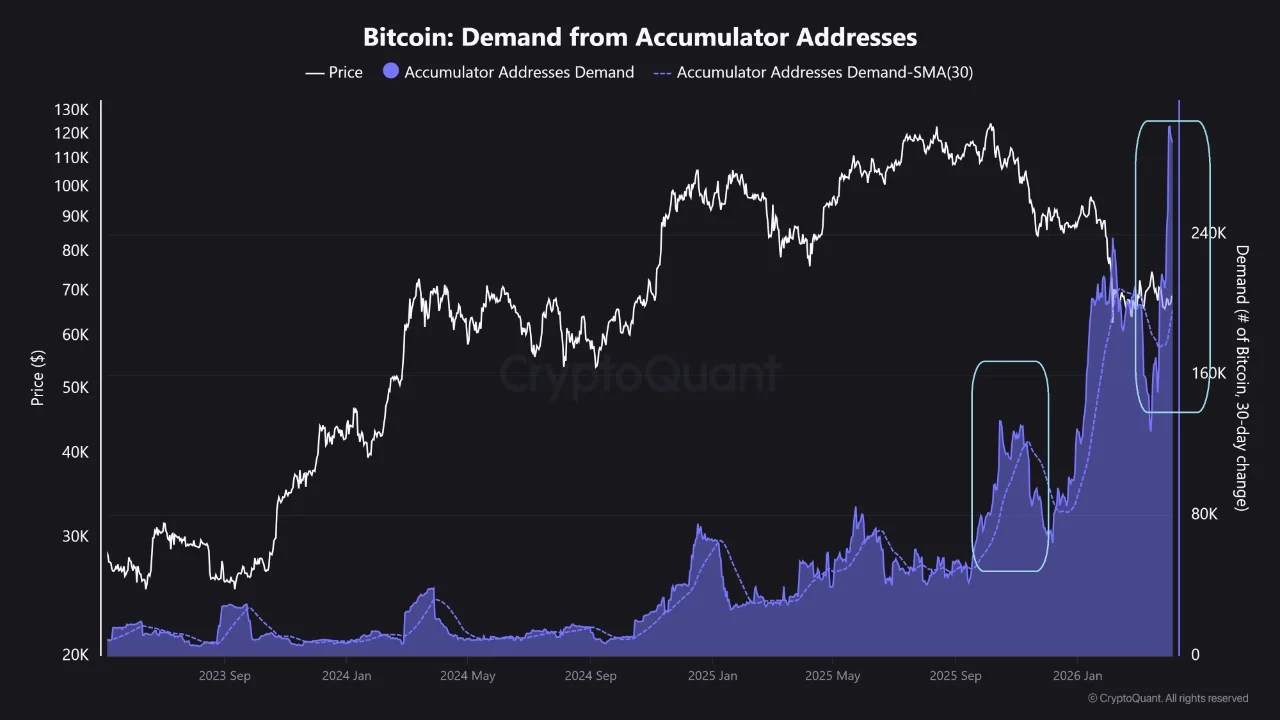
The significance of the current situation lies within the trajectory of demand itself; however, it falls short as an independent indicator due to lack of confirmation through pricing movements. The report specifies that for this accumulator signal to transition from suggestive to compelling status: there must be consistent upward movement in both the 30-day moving average metric and price levels concurrently establishing true acceptance at elevated ranges. Each element alone lacks completeness—the combination strengthens overall arguments considerably.
On a medium-term basis, structural conditions appear favorable—a realistic assessment supported by data—not indicative of new trends or confirmed breakouts but rather reinforcing foundations laid down by patient market capital.
Foundations do not ensure structures will rise—they merely allow them potentiality; Bitcoin’s accumulation data represents such groundwork yet remains undecided regarding further developments based upon it.
Bitcoin Remains Stagnant Below Resistance Amidst Tightening Range Structure
Currently trading around $68,400 range-bound level suggests consolidation exists although broader daily structure persists intact indicating recovery amidst ongoing downtrend rather than definitive reversal signs emerging just yet.Price continues residing beneath all three major moving averages (50-day ,100-day ,200-day) which trend downward acting dynamically resistant above
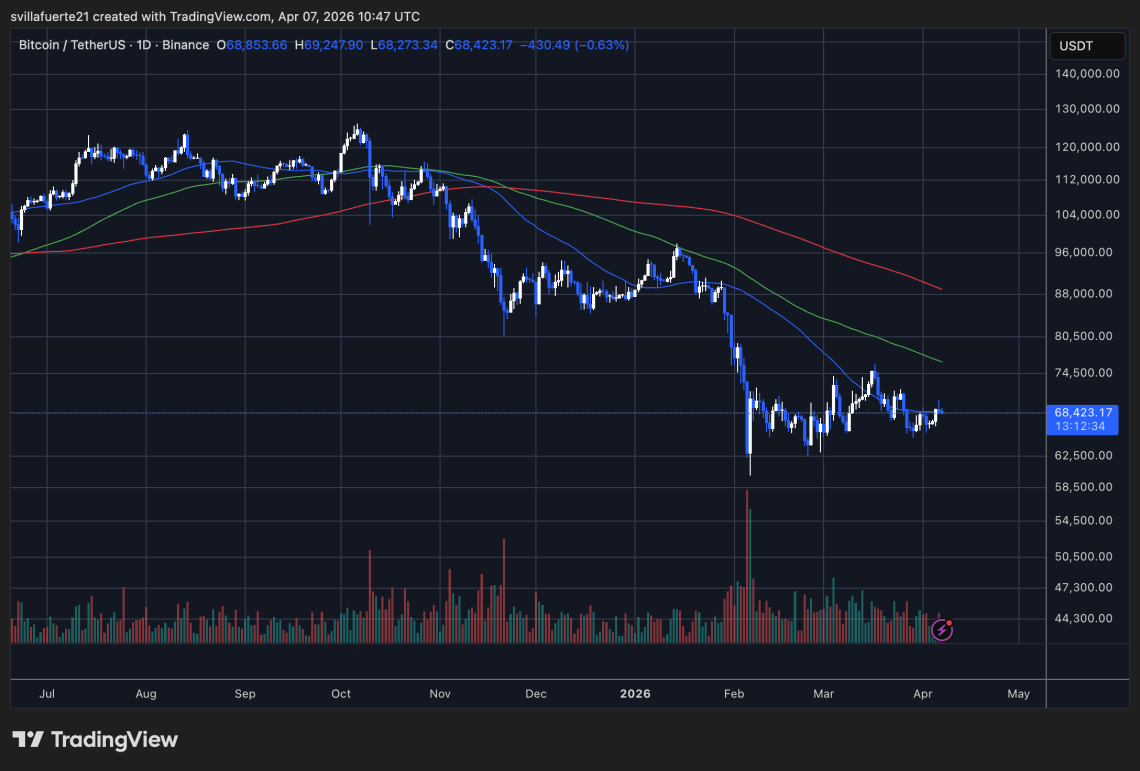
The sell-off witnessed back in February marked significant structural changes when Bitcoin fell below critical support zones ($90k-$95k) leading into capitulation towards approximately ($60k), coinciding with substantial volume spikes resetting positioning across traders establishing present trading ranges roughly spanning between ($62k-$72k).
Since then observed price activity tightened considerably ;recent attempts bouncing up towards(72K )failed maintaining lower high formations . Currently bitcoin compresses nearer midpoint within established range characterized declining volatility alongside normalizing volumes . Such contraction patterns usually precede expansions although directional clarity remains elusive still
.
An important detail arises noting repeated failures around (50 day MA) implying active selling during rallies until reclaimed upside efforts warrant cautious treatment.
A breakout beyond(72K )would alter short term momentum paving pathways higher whereas breakdown beneath(62K )likely triggers fresh downside continuations.
Featured image sourced via ChatGPT ; charts provided courtesy TradingView.com