
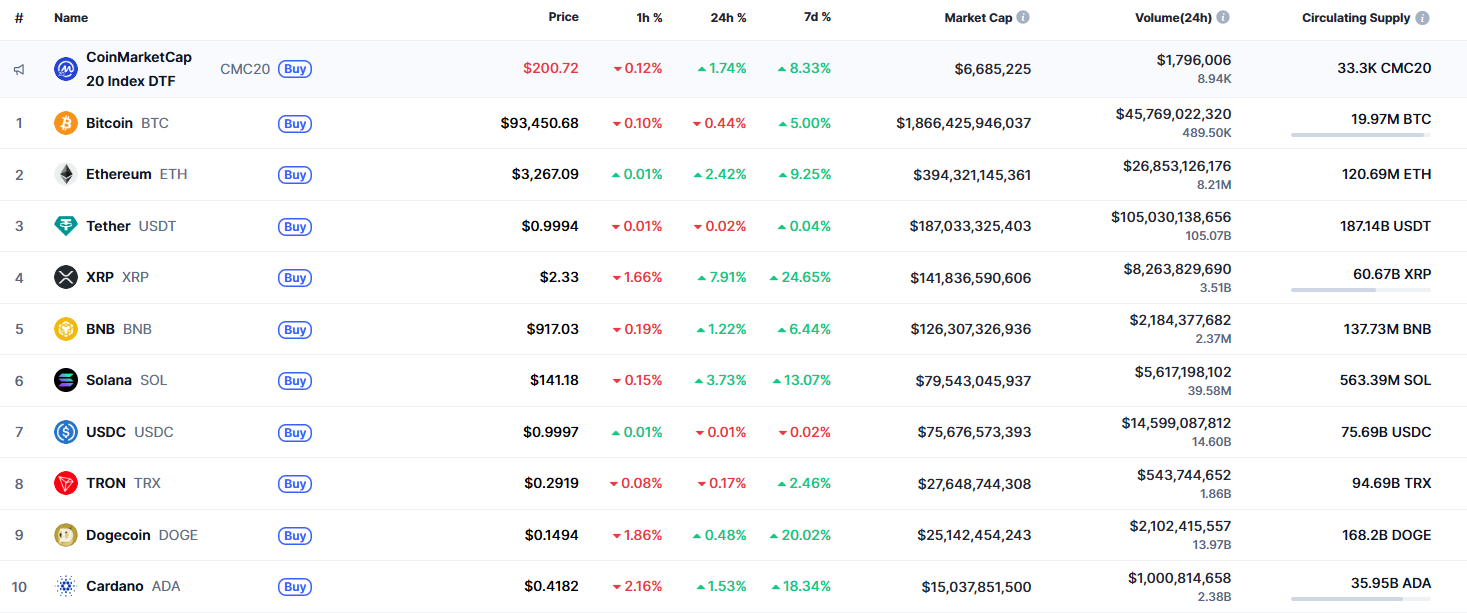
According to CoinMarketCap, the bullish sentiment is currently dominating over bearish trends.
BTC/USD
Bitcoin (BTC) stands out as an exception, experiencing a slight decline of 0.44% in the past day.

The hourly chart indicates that BTC is approaching local support at $93,121. Should selling pressure persist, a breakdown below this level could lead to further declines towards the $92,500-$93,000 range.
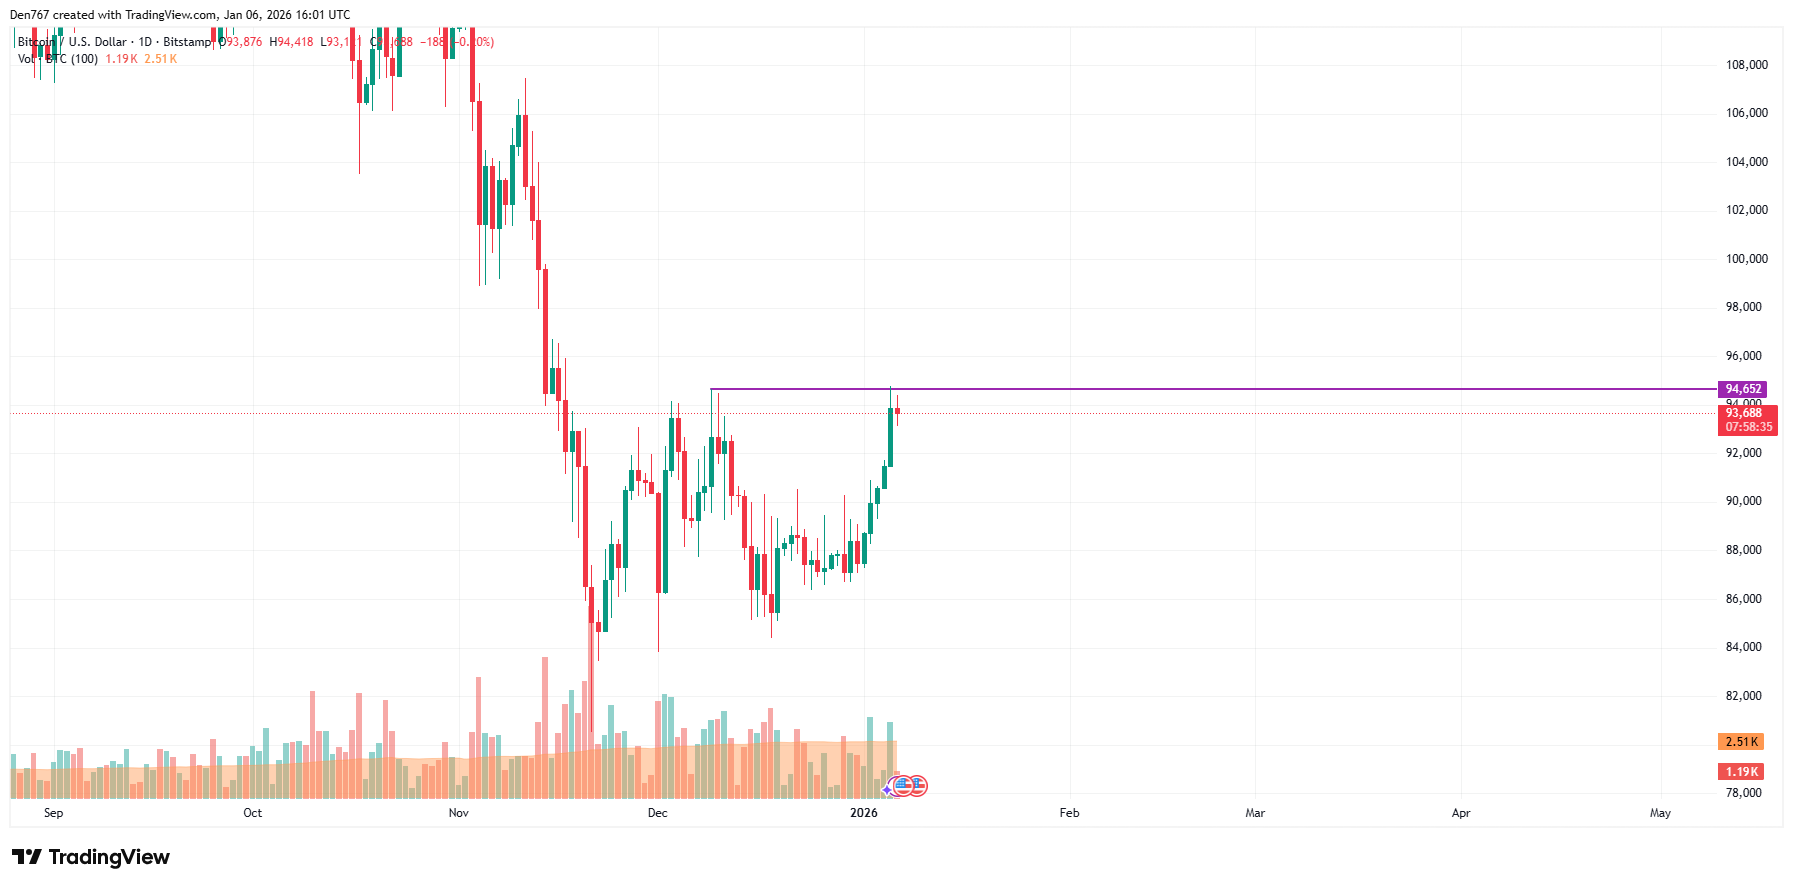
On a broader time scale, Bitcoin has recently executed a false breakout from its established resistance at $94,652.
If today’s closing price remains significantly distant from this resistance point, there’s a strong possibility that we will see testing of the $92,000-$93,000 zone within this week.
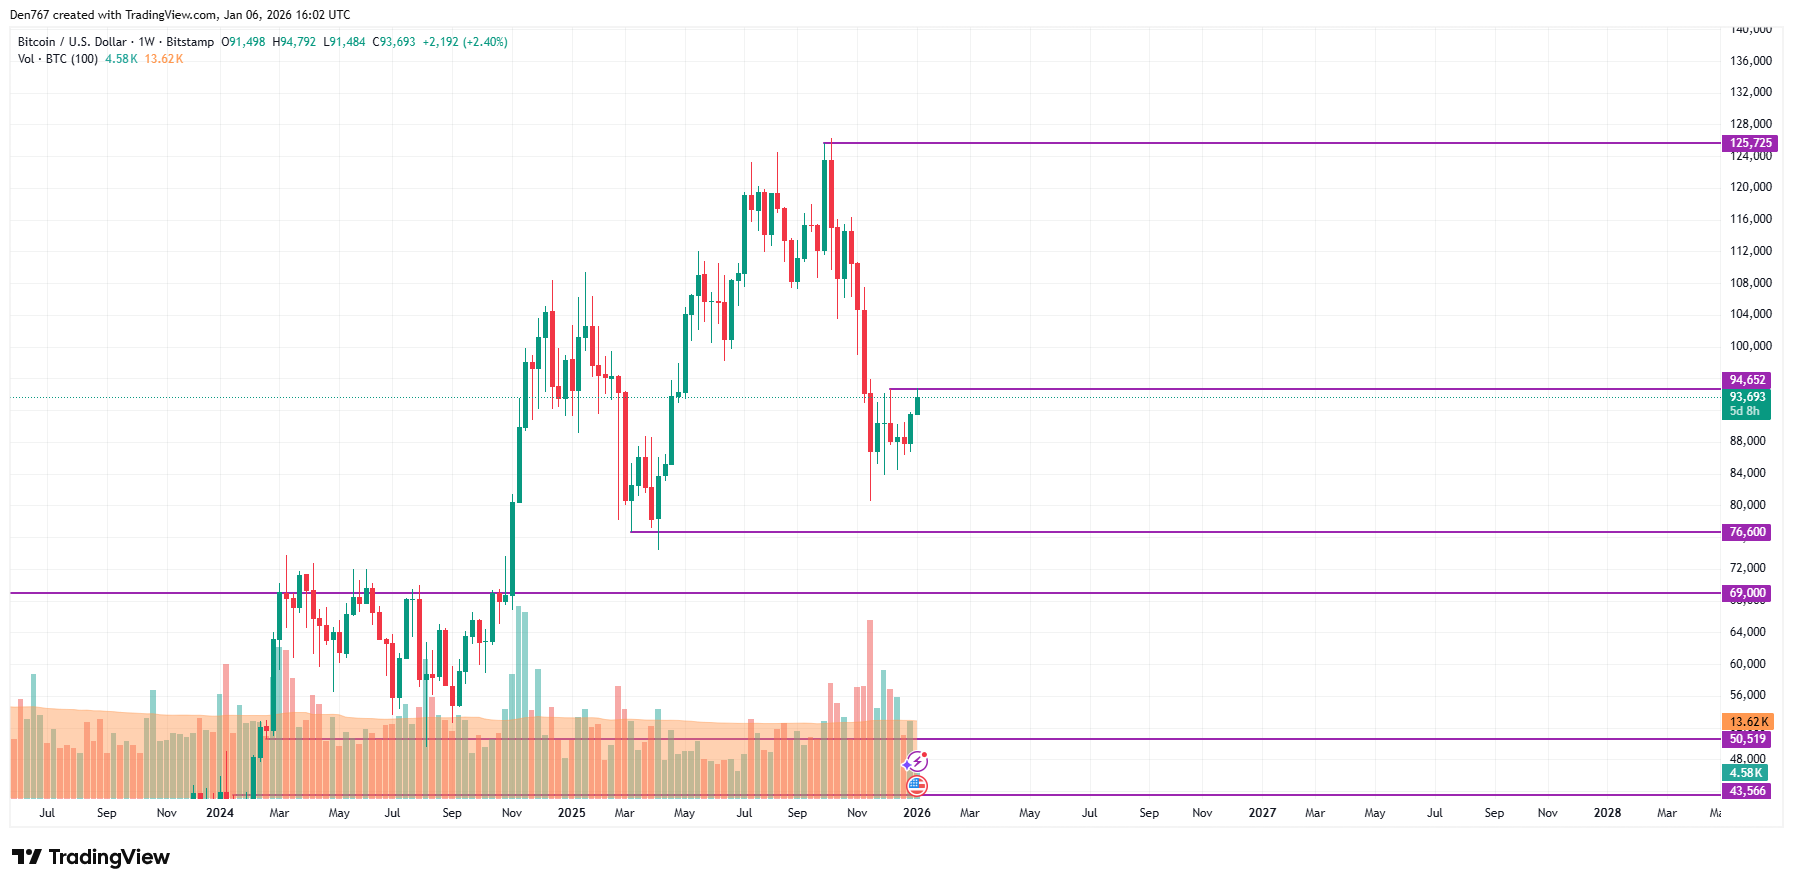
From a mid-term perspective, traders should keep an eye on the immediate resistance level of $94,652. If bulls manage to maintain their momentum here, it could potentially generate enough energy for Bitcoin to surge towards the $100K mark.
As of now, Bitcoin is trading at approximately $93,724.