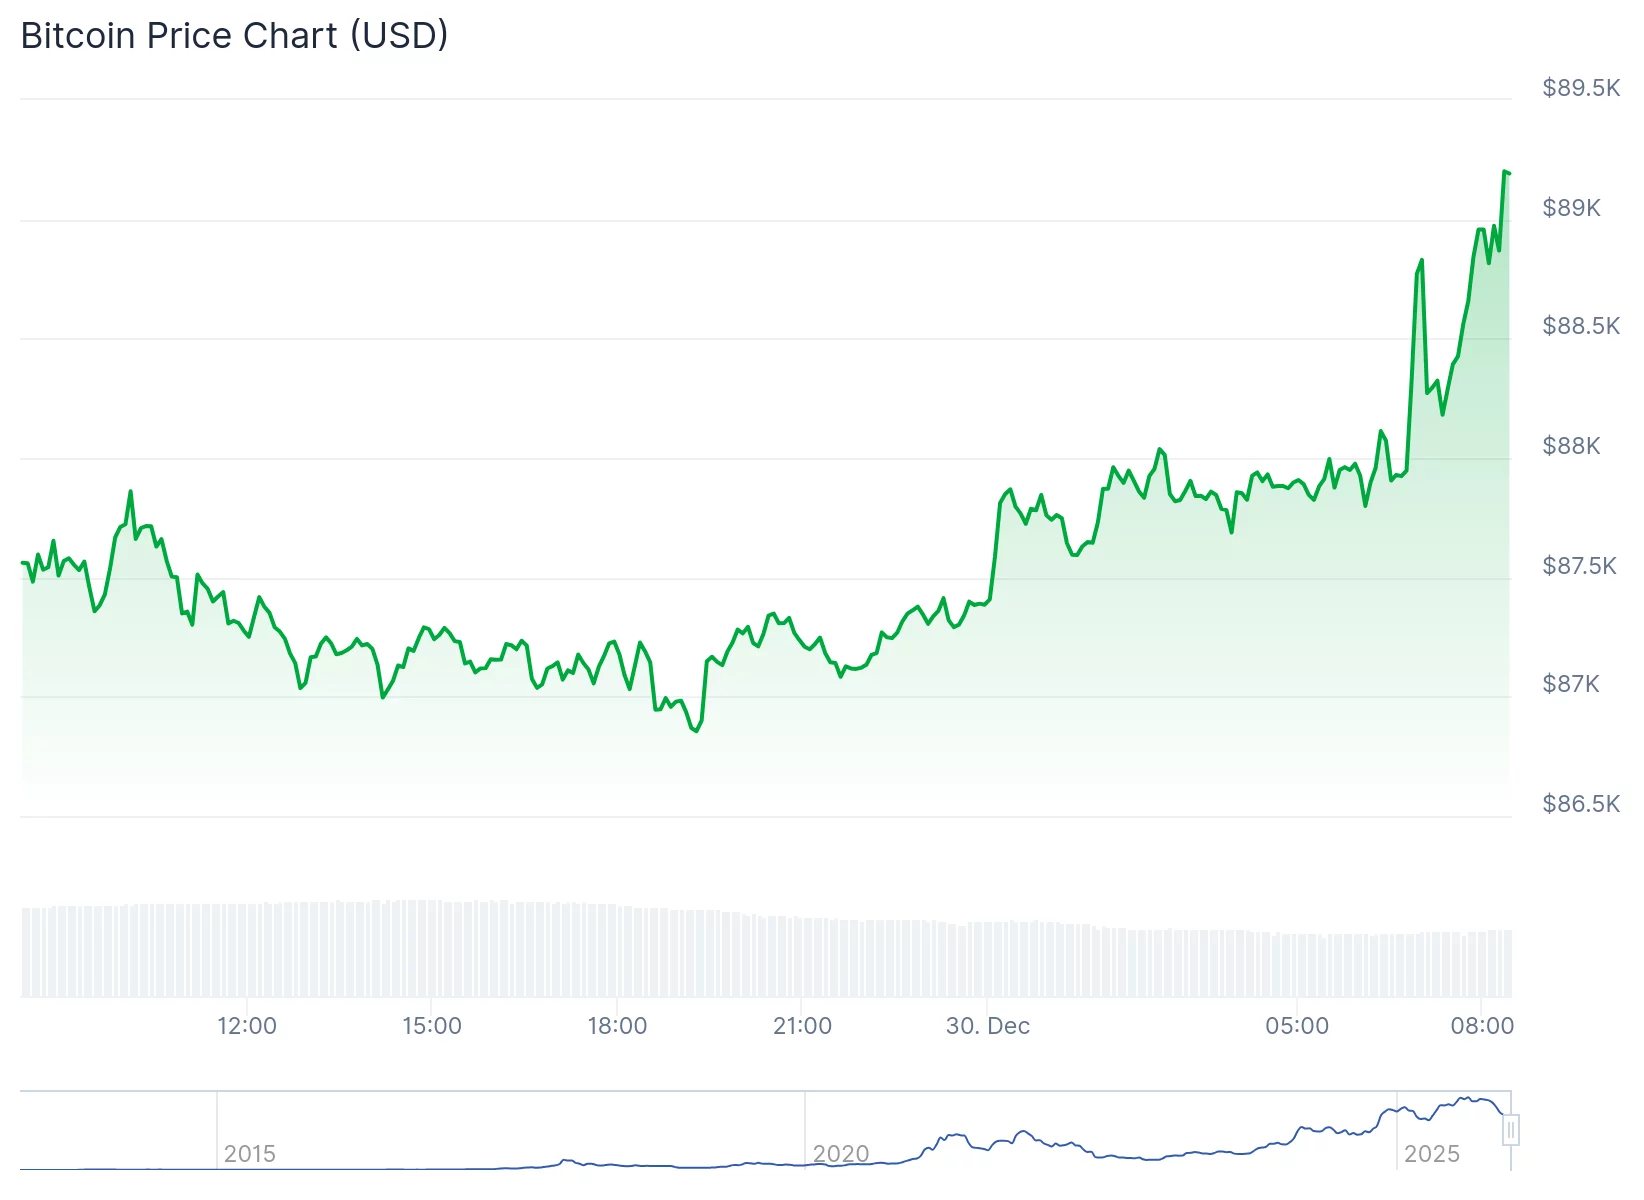
The price of Bitcoin has officially entered a technical bear market, having dropped approximately 30% from its all-time peak of $126,250 down to around $89,000.
Bitcoin is displaying multiple bearish chart formations that suggest a further decline may be imminent in the weeks ahead. Meanwhile, the Federal Reserve is set to release the minutes from its latest monetary policy meeting at 2 p.m. EST.
A Polymarket poll involving over $1 million in assets forecasts that the Fed will reduce interest rates twice more this year, although some participants anticipate three rate cuts.
Leading up to the release of the Federal Open Market Committee (FOMC) minutes, Bitcoin (BTC) has been showing several negative technical indicators hinting at deeper losses.
The upcoming minutes—scheduled for publication at 2:00 p.m. Eastern Time—will shed light on discussions from the last Fed meeting where officials decided on a third consecutive 0.25% interest rate cut this year.
At present, rates stand between 3.50% and 3.75%, with hints suggesting another reduction could occur within the next twelve months; however, many analysts expect even more aggressive easing measures.
According to a Polymarket survey backed by substantial funds exceeding one million dollars in value, two additional rate cuts are predicted while others foresee as many as three reductions before year-end.
Technical Analysis Reveals Bearish Trends for Bitcoin
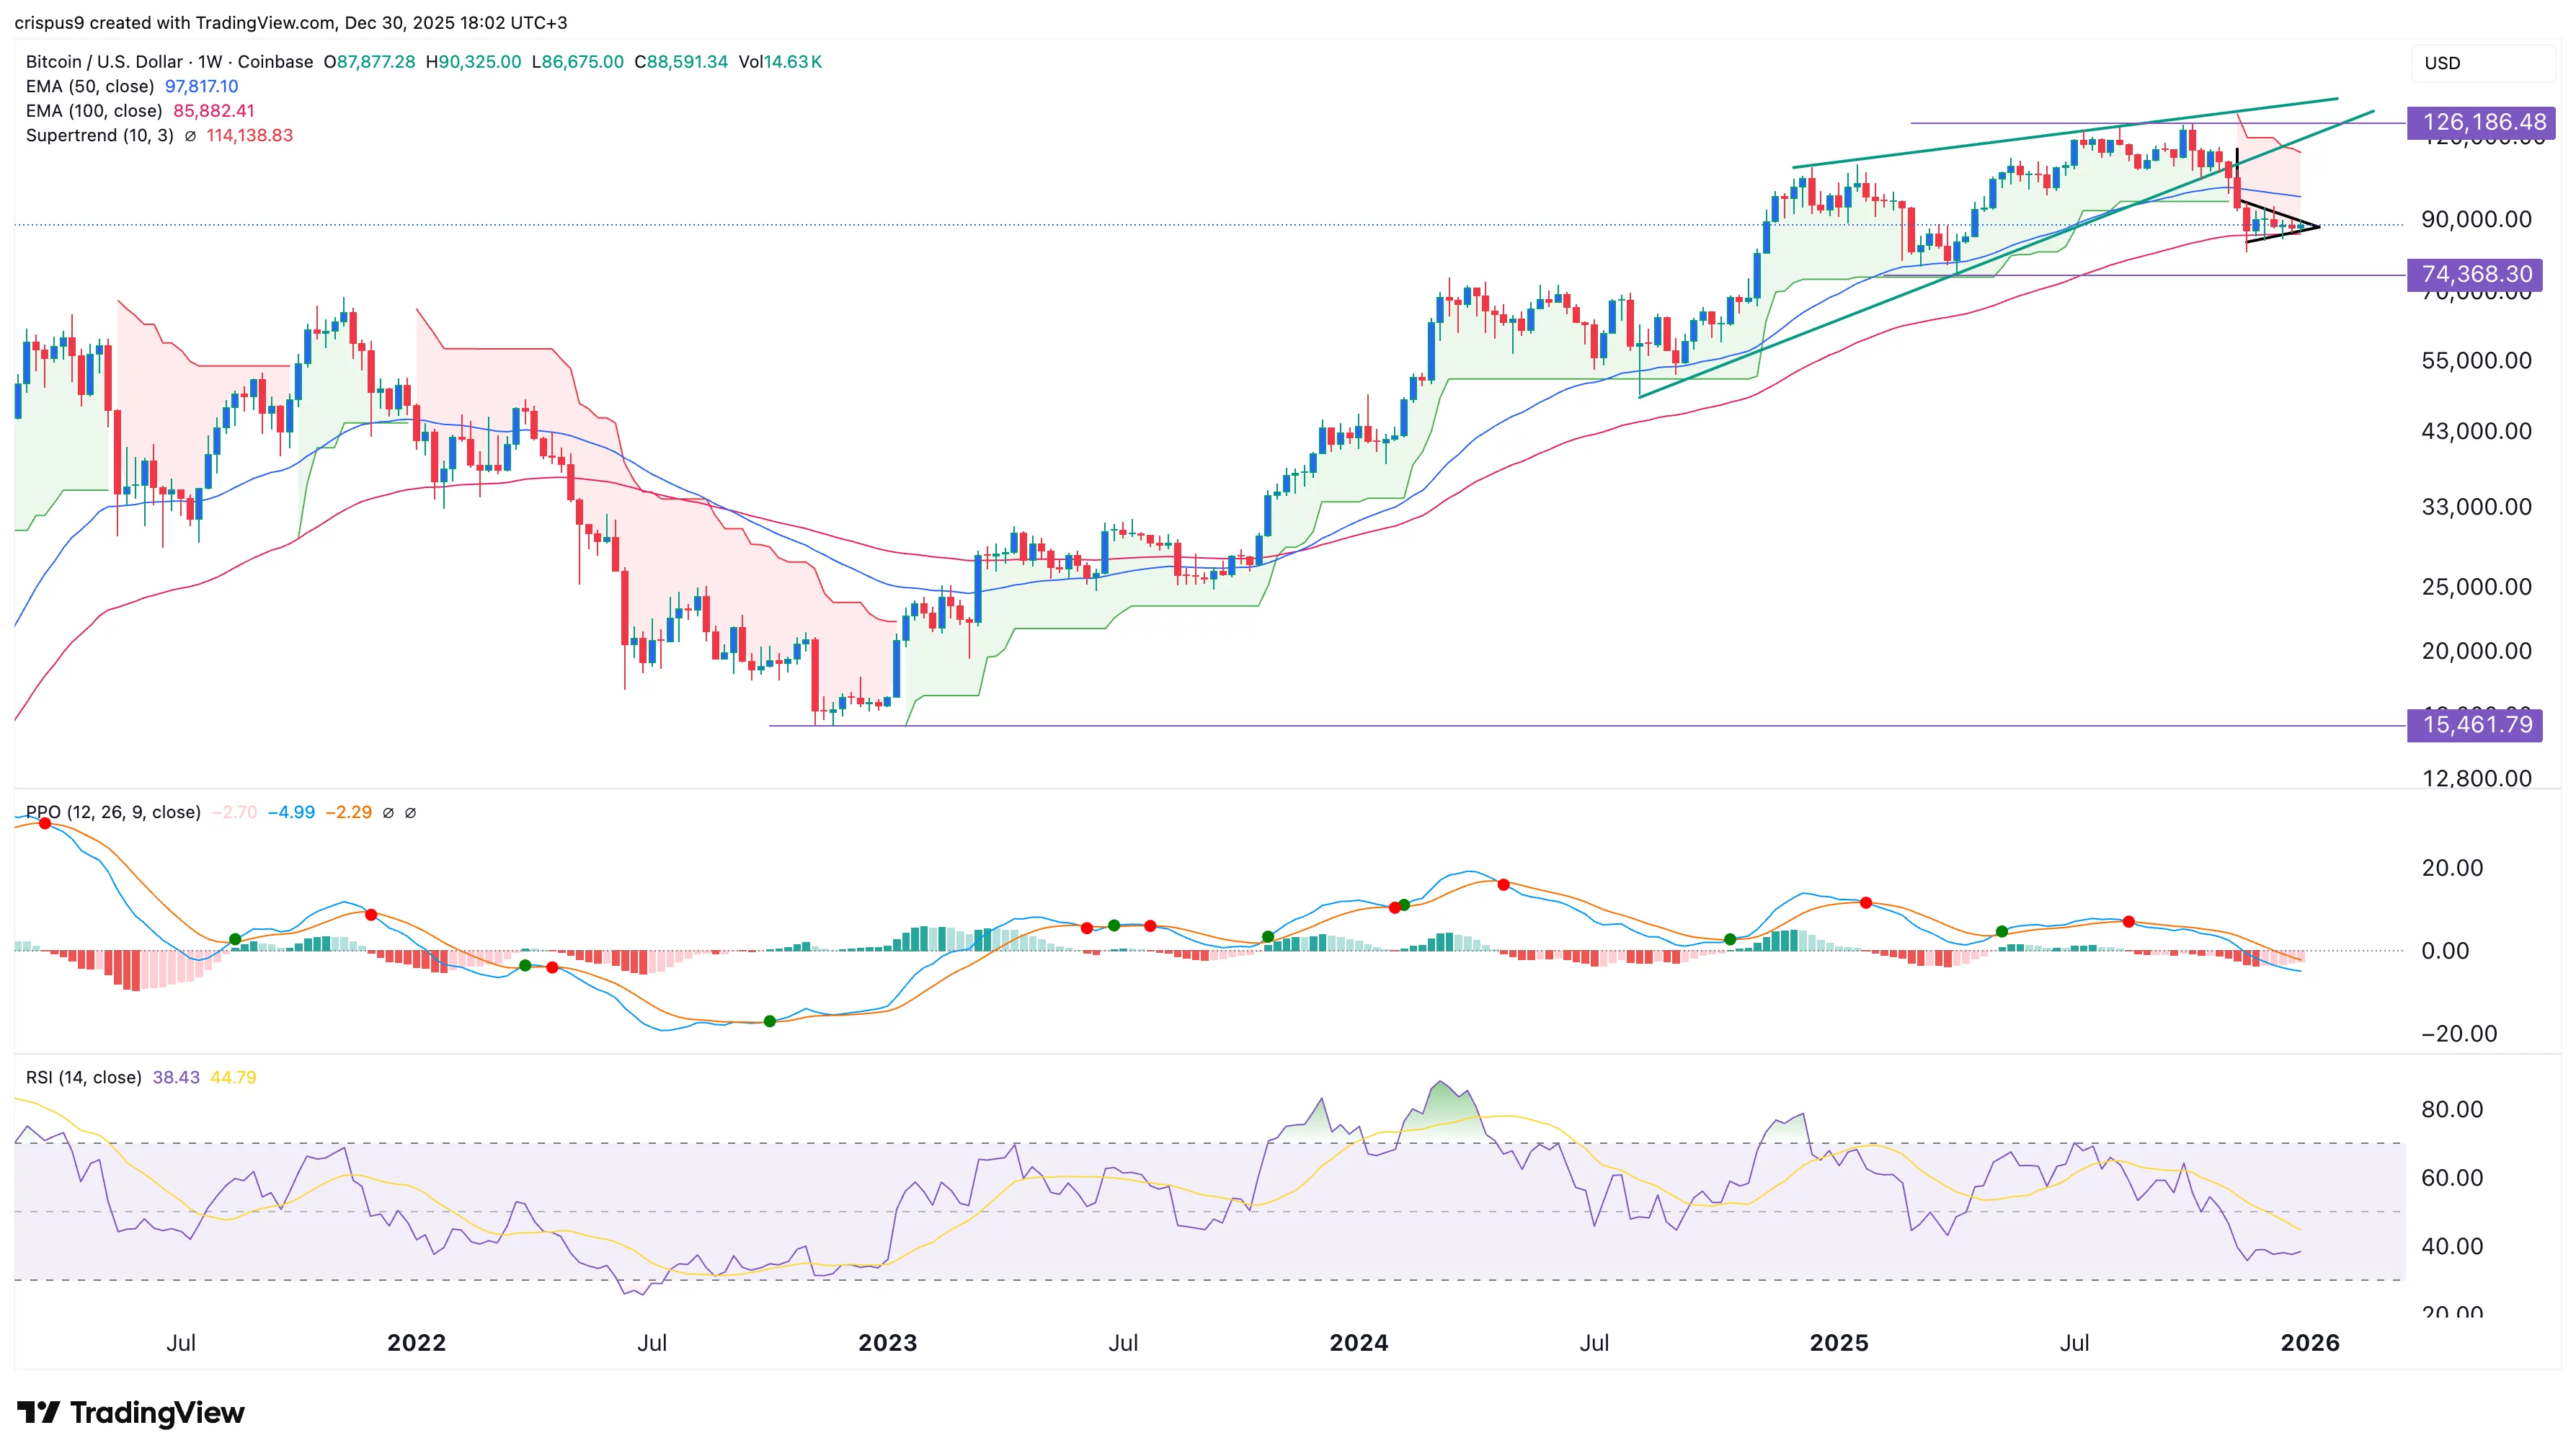
An examination of weekly charts reveals that Bitcoin’s bullish rally began near $15,460 on November 22 and surged to an unprecedented high close to $126,200 by October this year.
Signs indicate this upward momentum may be waning as several bearish patterns have emerged — notably a rising wedge formed by two converging ascending trendlines signaling potential reversal pressure.
The cryptocurrency also appears poised within a bearish pennant pattern characterized by a vertical spike followed by symmetrical triangle consolidation nearing convergence points—a setup often preceding downward breakouts.
Divergences appear across key oscillators too: The Percentage Price Oscillator peaked back in April last year but recently slipped below zero while Relative Strength Index values fell beneath neutral territory (50), trending downward further confirming weakening momentum.
A critical development is BTC’s drop below its Supertrend indicator which turned red last November—the previous occurrence coincided with steep declines from roughly $52K down toward lows near $15K during early 2022 alike conditions now suggest potential for significant downside movement again soon following similar patterns observed previously .
This analysis suggests Bitcoin could experience strong bearish breakout pressures potentially driving prices toward major support levels around $74,&368—the lowest point reached last April—and if breached might open doors towards psychological thresholds near or below $70,&000 .
Forecasts for Bitcoin’s Trajectory into 2026
The past year’s inaccurate predictions—including Chamath Palihapitiya’s widely discussed forecast expecting bitcoin at certain highs by October ’25—have tempered enthusiasm surrounding precise price targets moving forward.
By late-2025 “target-price narratives” shifted away from confident prophecies towards cautious scenario planning with analysts favoring ranges over guarantees amid uncertain macroeconomic landscapes.
Accordingly , according to Wu Blockchain summaries , outlooks now encompass broad possibilities spanning booming bull markets fueled through ETF inflows plus institutional buying against sharp downturn risks should macro tightening or breakdowns arise technically .
- Bulls envision BTC climbing anywhere between $ ;150 ,000 and $ ;250 ,000 driven largely via spot ETFs adoption along Wall Street coupled with accommodative monetary policies .
- Bears caution about possible slides back down towards $ ;70 ,000 or even lower levels like $ ;60 ,000 if adverse conditions prevail .
Consensus exists only regarding what factors will truly influence bitcoin ’ s fate throughout next few years : liquidity availability regulatory environment shifts plus whether institutional investors maintain purchases despite unfavorable chart signals remain decisive elements determining future trajectory rather than traditional halving event lore alone.