Bitcoin is currently valued at $87,752, boasting a market capitalization of approximately $1.75 trillion and experiencing a 24-hour trading volume near $15.69 billion. Throughout the day, its price fluctuated between $87,363 and $87,893, reflecting a phase marked more by cautious hesitation than dramatic swings.
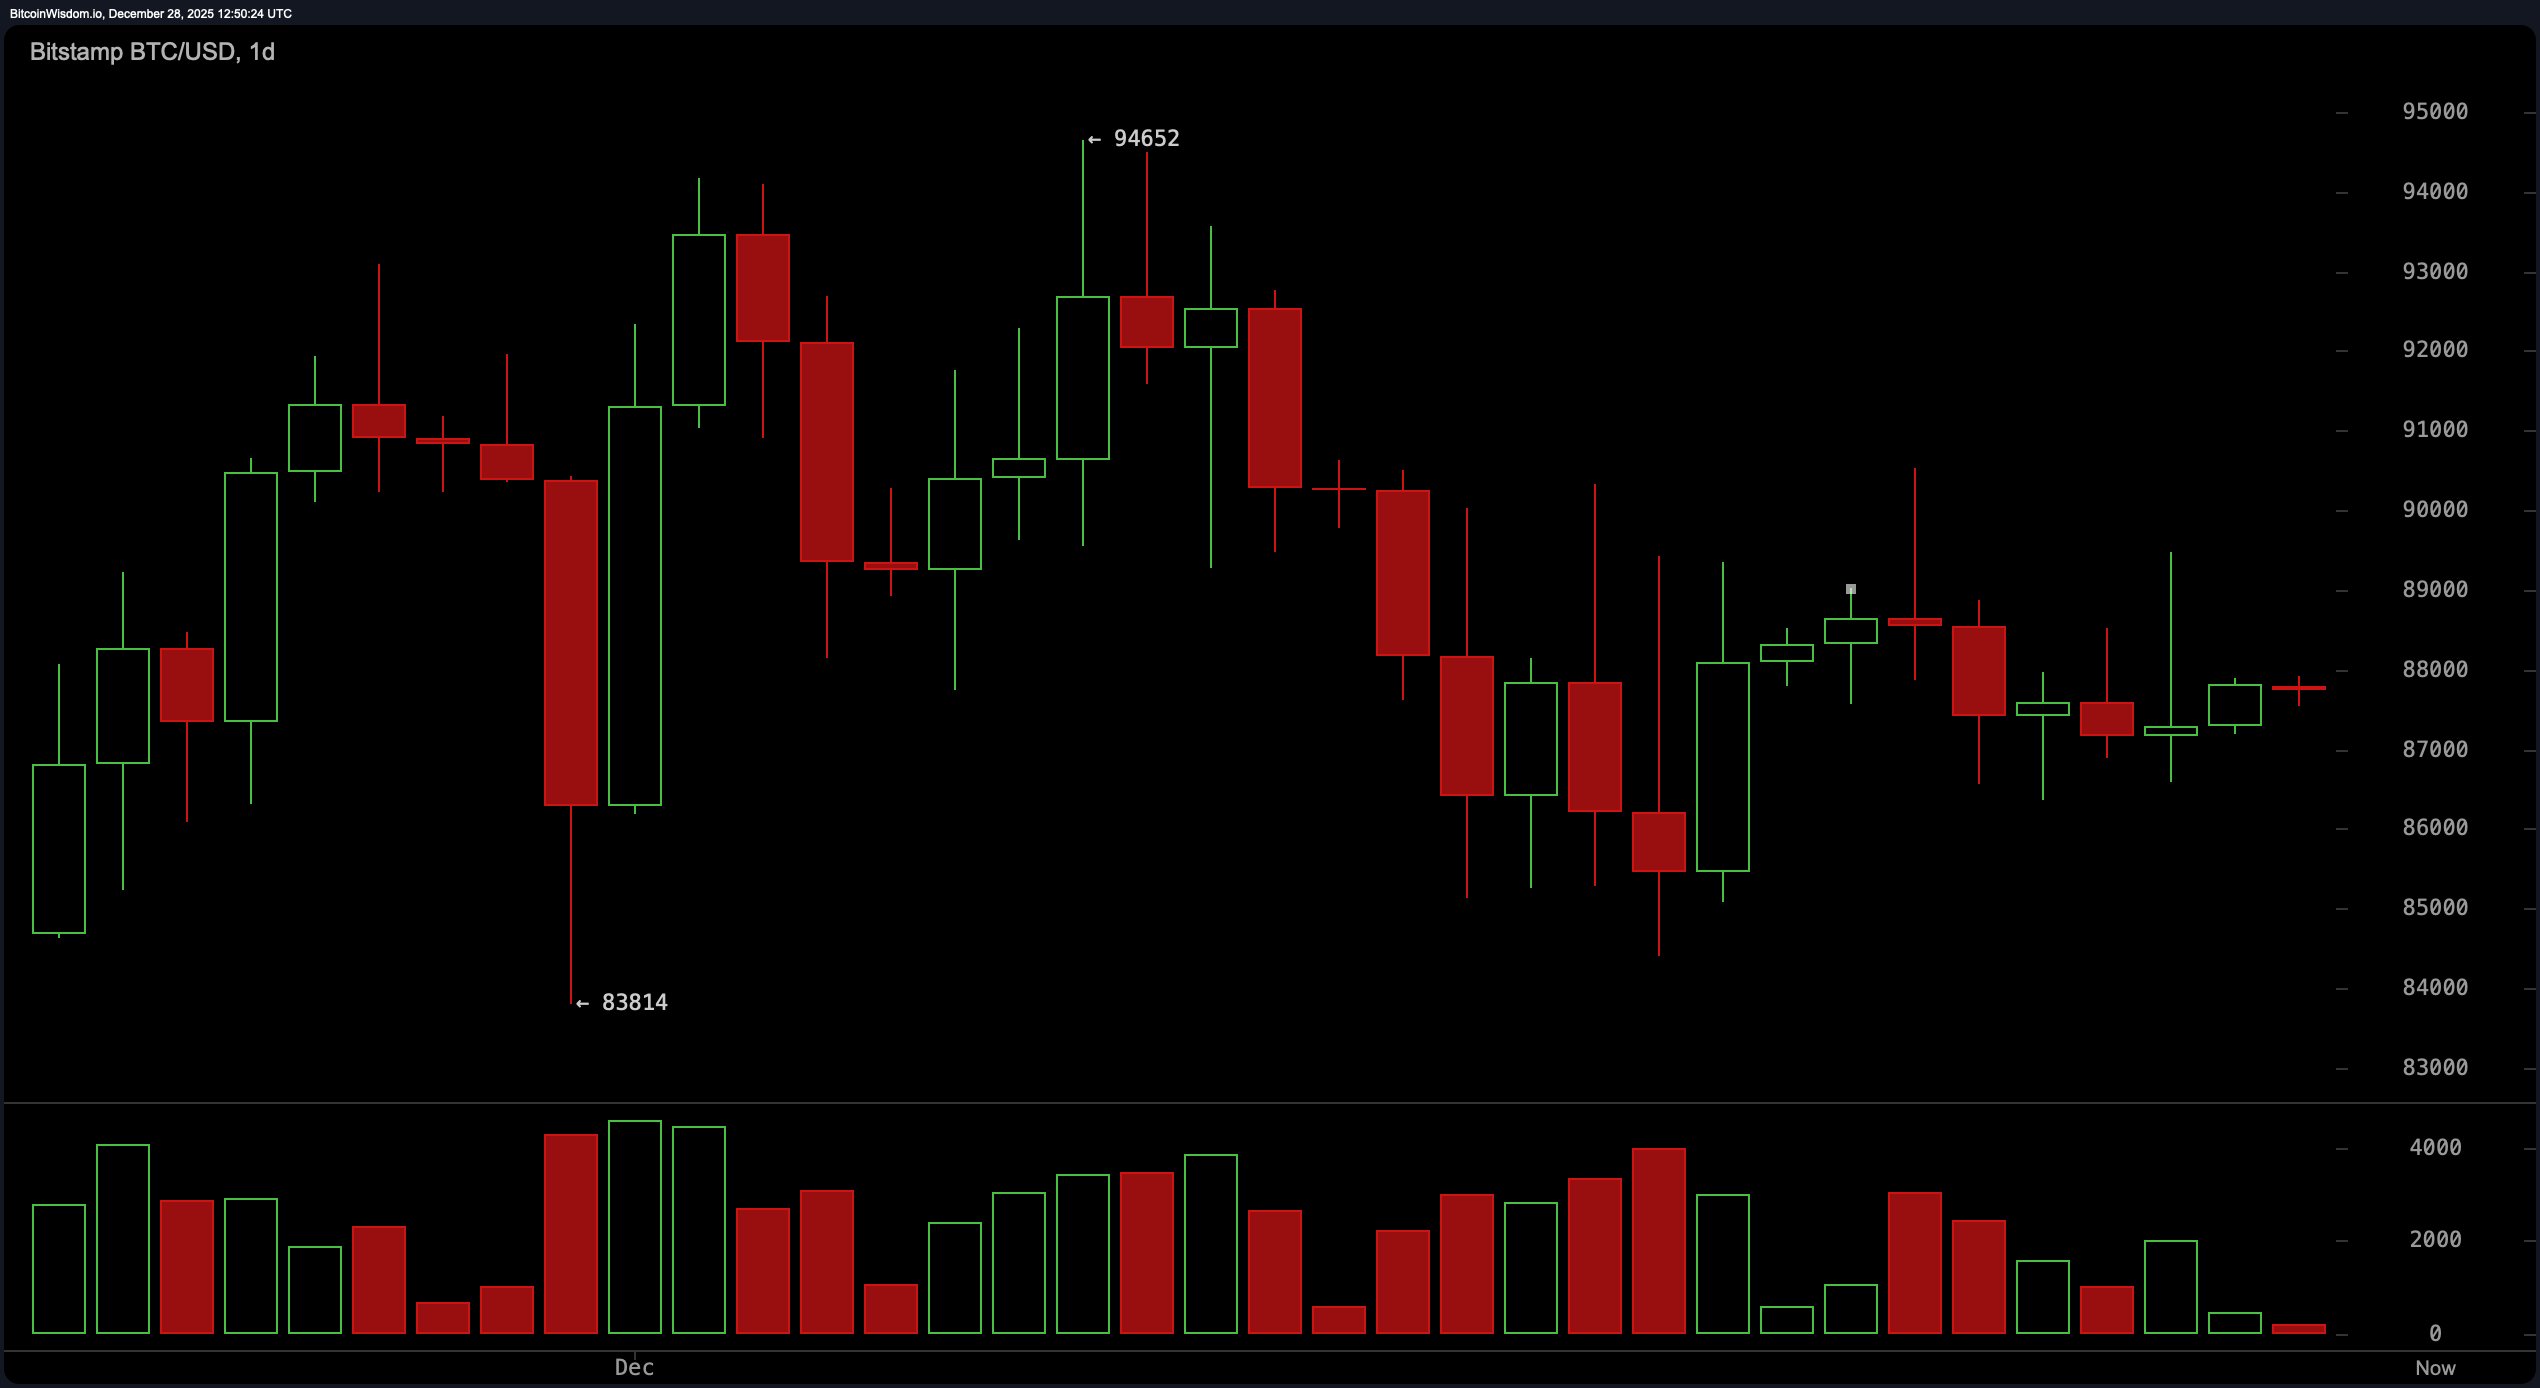
Analysis of Bitcoin’s Price Chart
The daily chart reveals that Bitcoin remains in a consolidation phase. After retreating from recent peaks, it is moving sideways within the range of roughly $83,800—tested twice as support—and resistance hovering around $94,600. Trading volumes suggest distribution patterns dominated by bearish activity since red candlesticks have captured most participation.
Technical momentum indicators show readings around 2,295 with the Moving Average Convergence Divergence (MACD) positioned at -1,148; these figures hint at mild bullish potential but warrant caution. Should Bitcoin revisit the critical support near $83,800 and form bullish reversal signals on its candlestick chart, this could ignite fresh upward momentum.
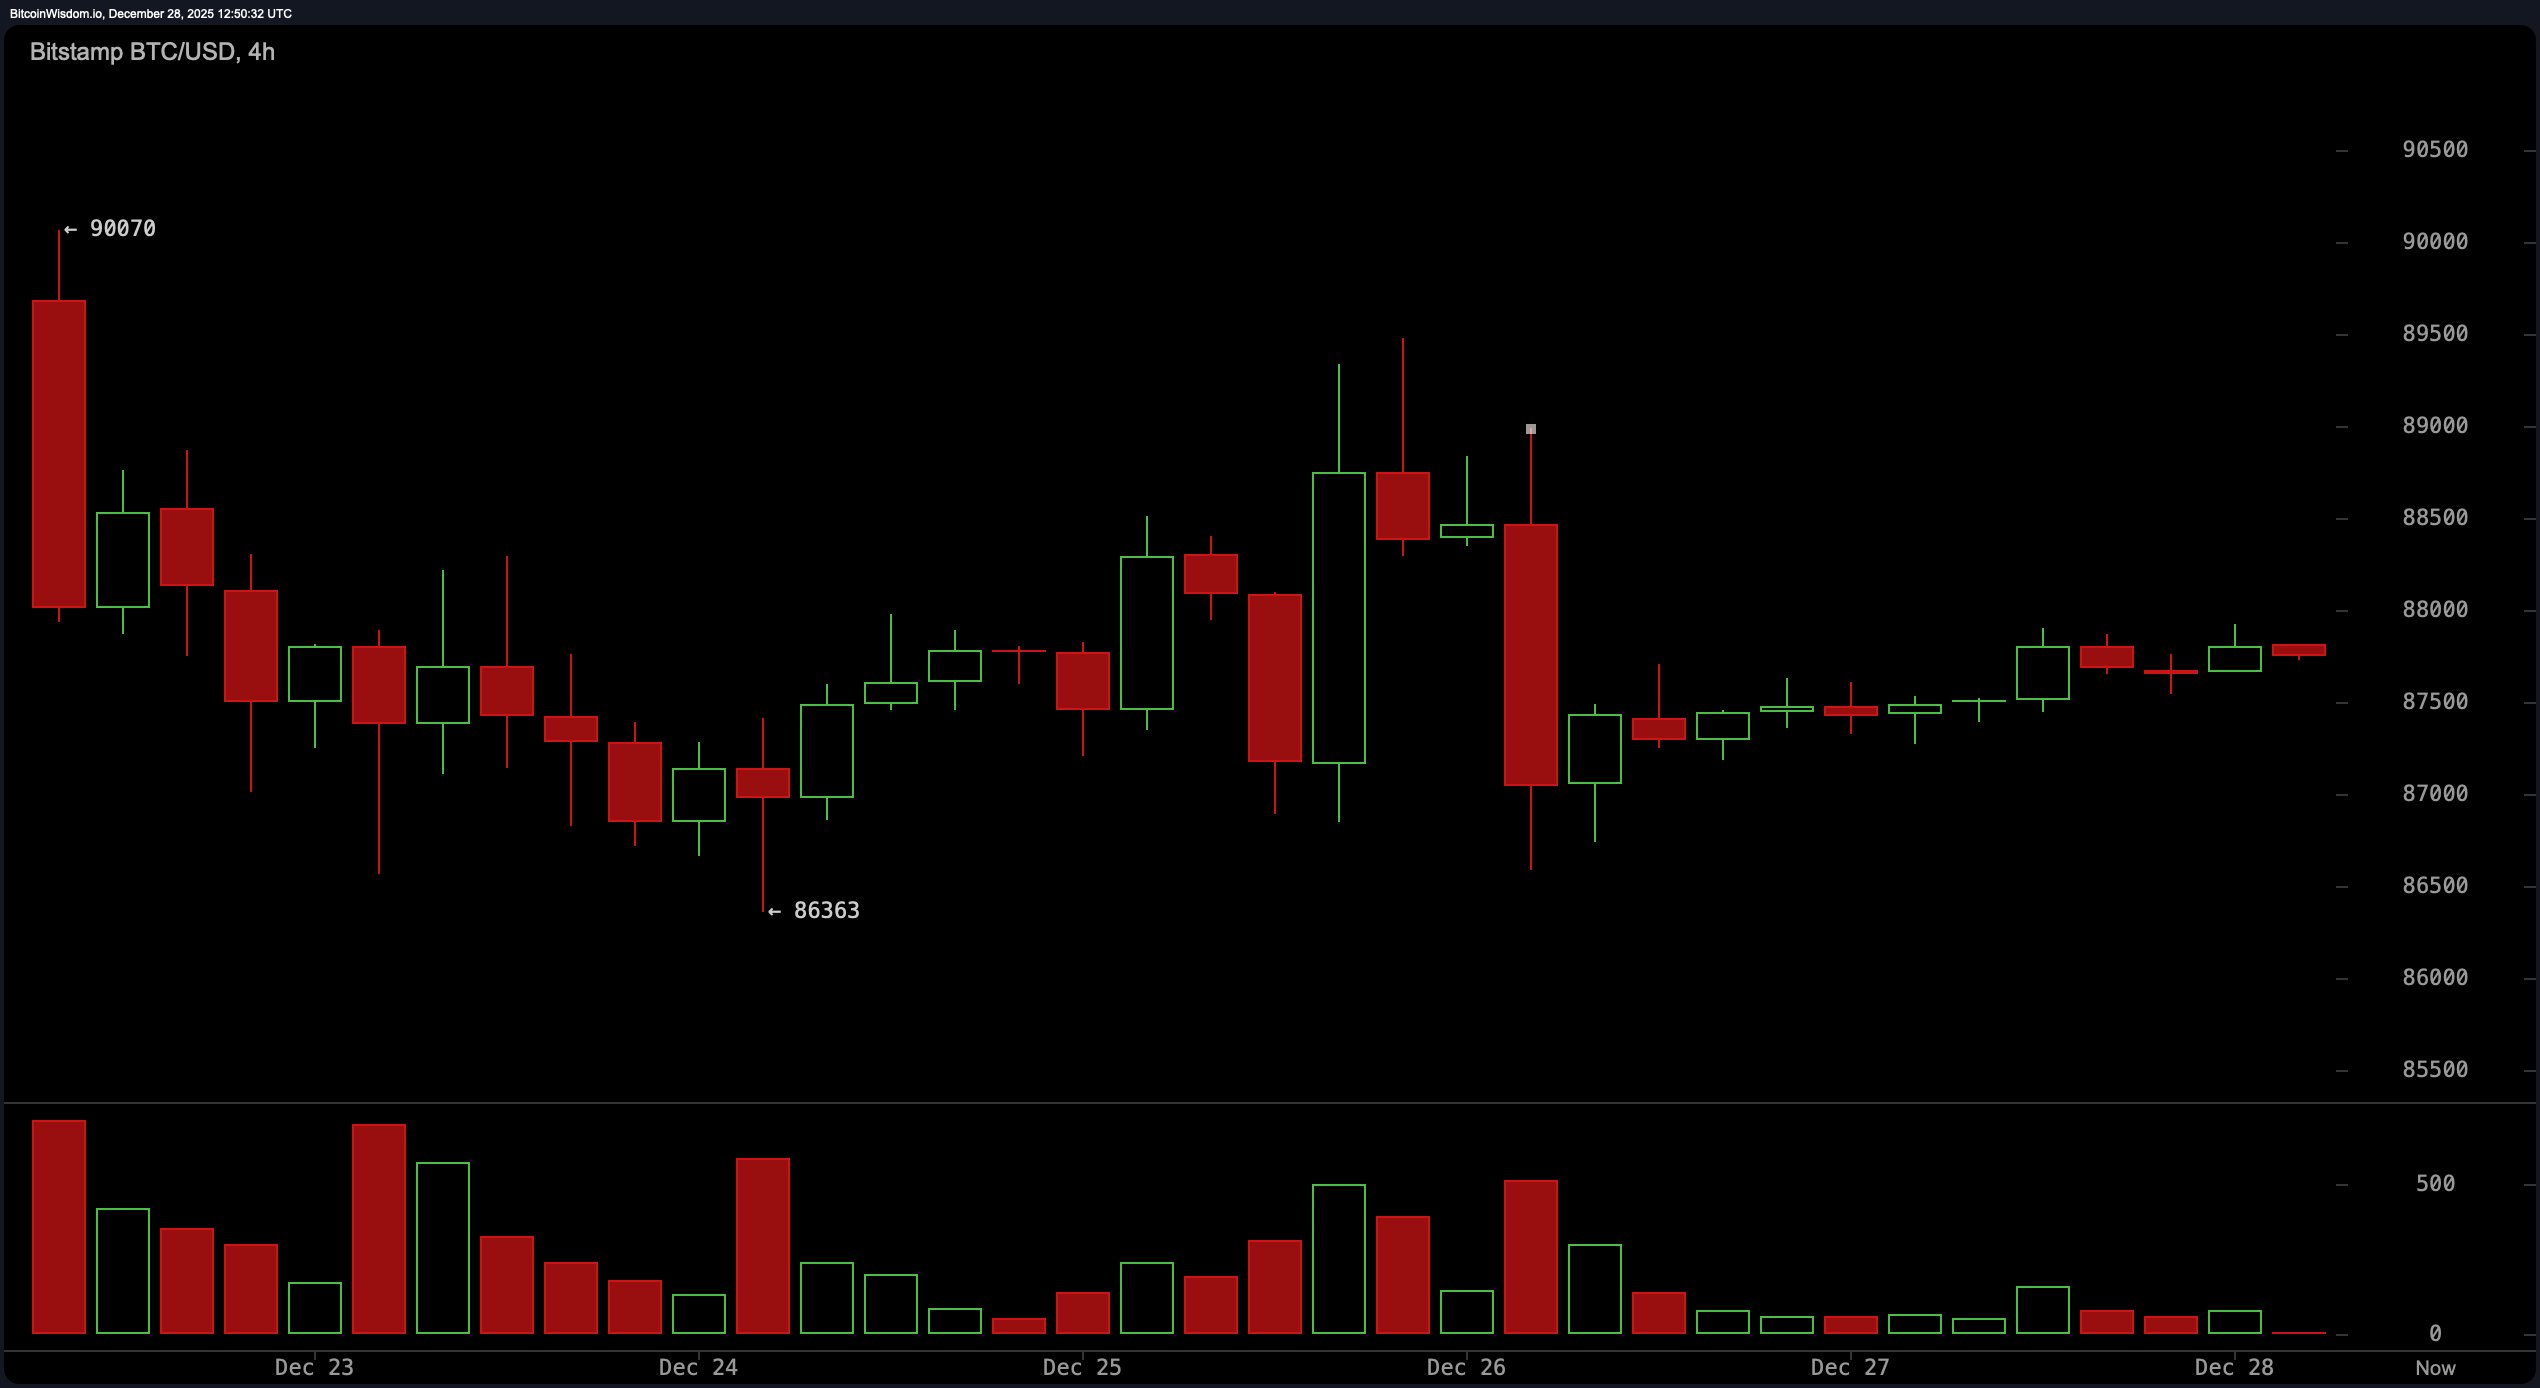
Examining the 4-hour timeframe shows that after dipping to about $86,363 following an uninspiring breakdown from roughly $90,070 earlier in December 2025 via Bitstamp data—the price has been oscillating sideways between approximately $86,300 and just under $88,000 amid declining volume levels. This scenario points to indecision among traders who should wait for clear breakout confirmation through strong candle formations coupled with rising volumes before entering positions.
If Bitcoin can push beyond this range towards targets between roughly $88,500 and up to about $90k in short order depends largely on renewed buying strength overcoming current hesitations.
Diving deeper into hourly charts reveals an even tighter trading band confined between nearly $87,272 and $87,920 accompanied by diminishing trade volumes—a sign that market participants are uncertain or waiting for clearer cues.
A decisive move above $87,920 supported by robust volume might propel prices toward an initial target near $88,500, if not higher.
Conversely, if prices fall below approximately $87,200, a swift decline toward $86,500 could follow.
This environment favors mean-reversion strategies where buyers look for dips close to ~$87k while nimble scalpers capitalize on upper-bound fluctuations—requiring careful timing and precision.
The oscillator suite paints a picture of neutrality across multiple metrics:
- The Relative Strength Index (RSI) stands at 45
- The Stochastic Oscillator hovers around 52
- The Commodity Channel Index (CCI) reads -41
- The Average Directional Index (ADX) measures just 19 indicating weak trend strength
- The Awesome Oscillator posts mild negative values (-1,…) reinforcing indecisiveness
Tiny bullish signals appear intermittently from MACD alongside momentum indicators but overall sentiment remains subdued amidst ongoing consolidation phases.
Bullish Perspective:
If Bitcoin manages to maintain support within the zone spanning ~$86,&;500–$87,&;000 while reclaiming key resistance levels such as ~$88k backed by solid trading volume then prospects brighten considerably toward gains targeting roughly ~$89k initially followed potentially by moves reaching back up near ~$94k.
Momentum appears poised for revival pending confirmation through sustained breakouts beyond current ranges signaling continuation of recovery efforts.
Bearish Perspective:
Given persistent pressure below all significant moving averages combined with dwindling volumes underpinning sell-side dominance risk remains tilted downward.
Should prices breach below critical thresholds like ~& #36 ;& #56 ; & #55 ; & #50 ; & #48 ; first followed swiftly thereafter falling beneath ~& #36 ; & #56 ; & #54 ; & #53 ; it may trigger accelerated selling leading bitcoin down towards established supports near ~$&##38;;83,800, or worse yet breaking those floors entirely causing sharper declines.
Frequently Asked Questions ❓
What is bitcoin’s latest price? As per December 28th ,2025 ,bitcoin trades close to $&rml;&#38#58;u003887752.
Is bitcoin trending upwards or downwards today? Currently ,bitcoin exhibits consolidation behavior without decisive directional bias .
Which levels serve as crucial support/resistance zones now ?& nbsp Support clusters exist near $u00838000 whereas resistance lies broadly ranging from $u00888000 up till approx . u0094600 .
What does short-term outlook indicate ?A breakout past u00888000 upside or drop beneath u00887200 downside would likely dictate next directional move .