
Currently, Bitcoin’s value is resting at $89,417, with a market capitalization of $1.78 trillion. In the past day, its price has fluctuated between $88,929.64 and $90,469 while experiencing a trading volume of approximately $35.66 billion—proving it remains a central figure in the liquidity scene despite some tension on the trading floor. Similar to yesterday’s analysis, BTC is in a phase of consolidation; however, bearish forces are persistently pressing down and may gain dominance if circumstances do not shift.
Bitcoin Price Analysis
The price action is precariously positioned just below the critical threshold of $90,000 following what can only be described as an intense breakdown from previous consolidation levels. The hourly chart for Bitcoin illustrates a sharp decline from about $90,600 to around $88,500—marked by spikes in volume that suggest panic or possibly liquidation-driven sell-offs.
Short-term support appears to be under scrutiny within the range of $88,500–$89,000; there are signs of cautious buying emerging—but it’s too early for celebration just yet as this movement lacked strong conviction beyond a brief rebound.
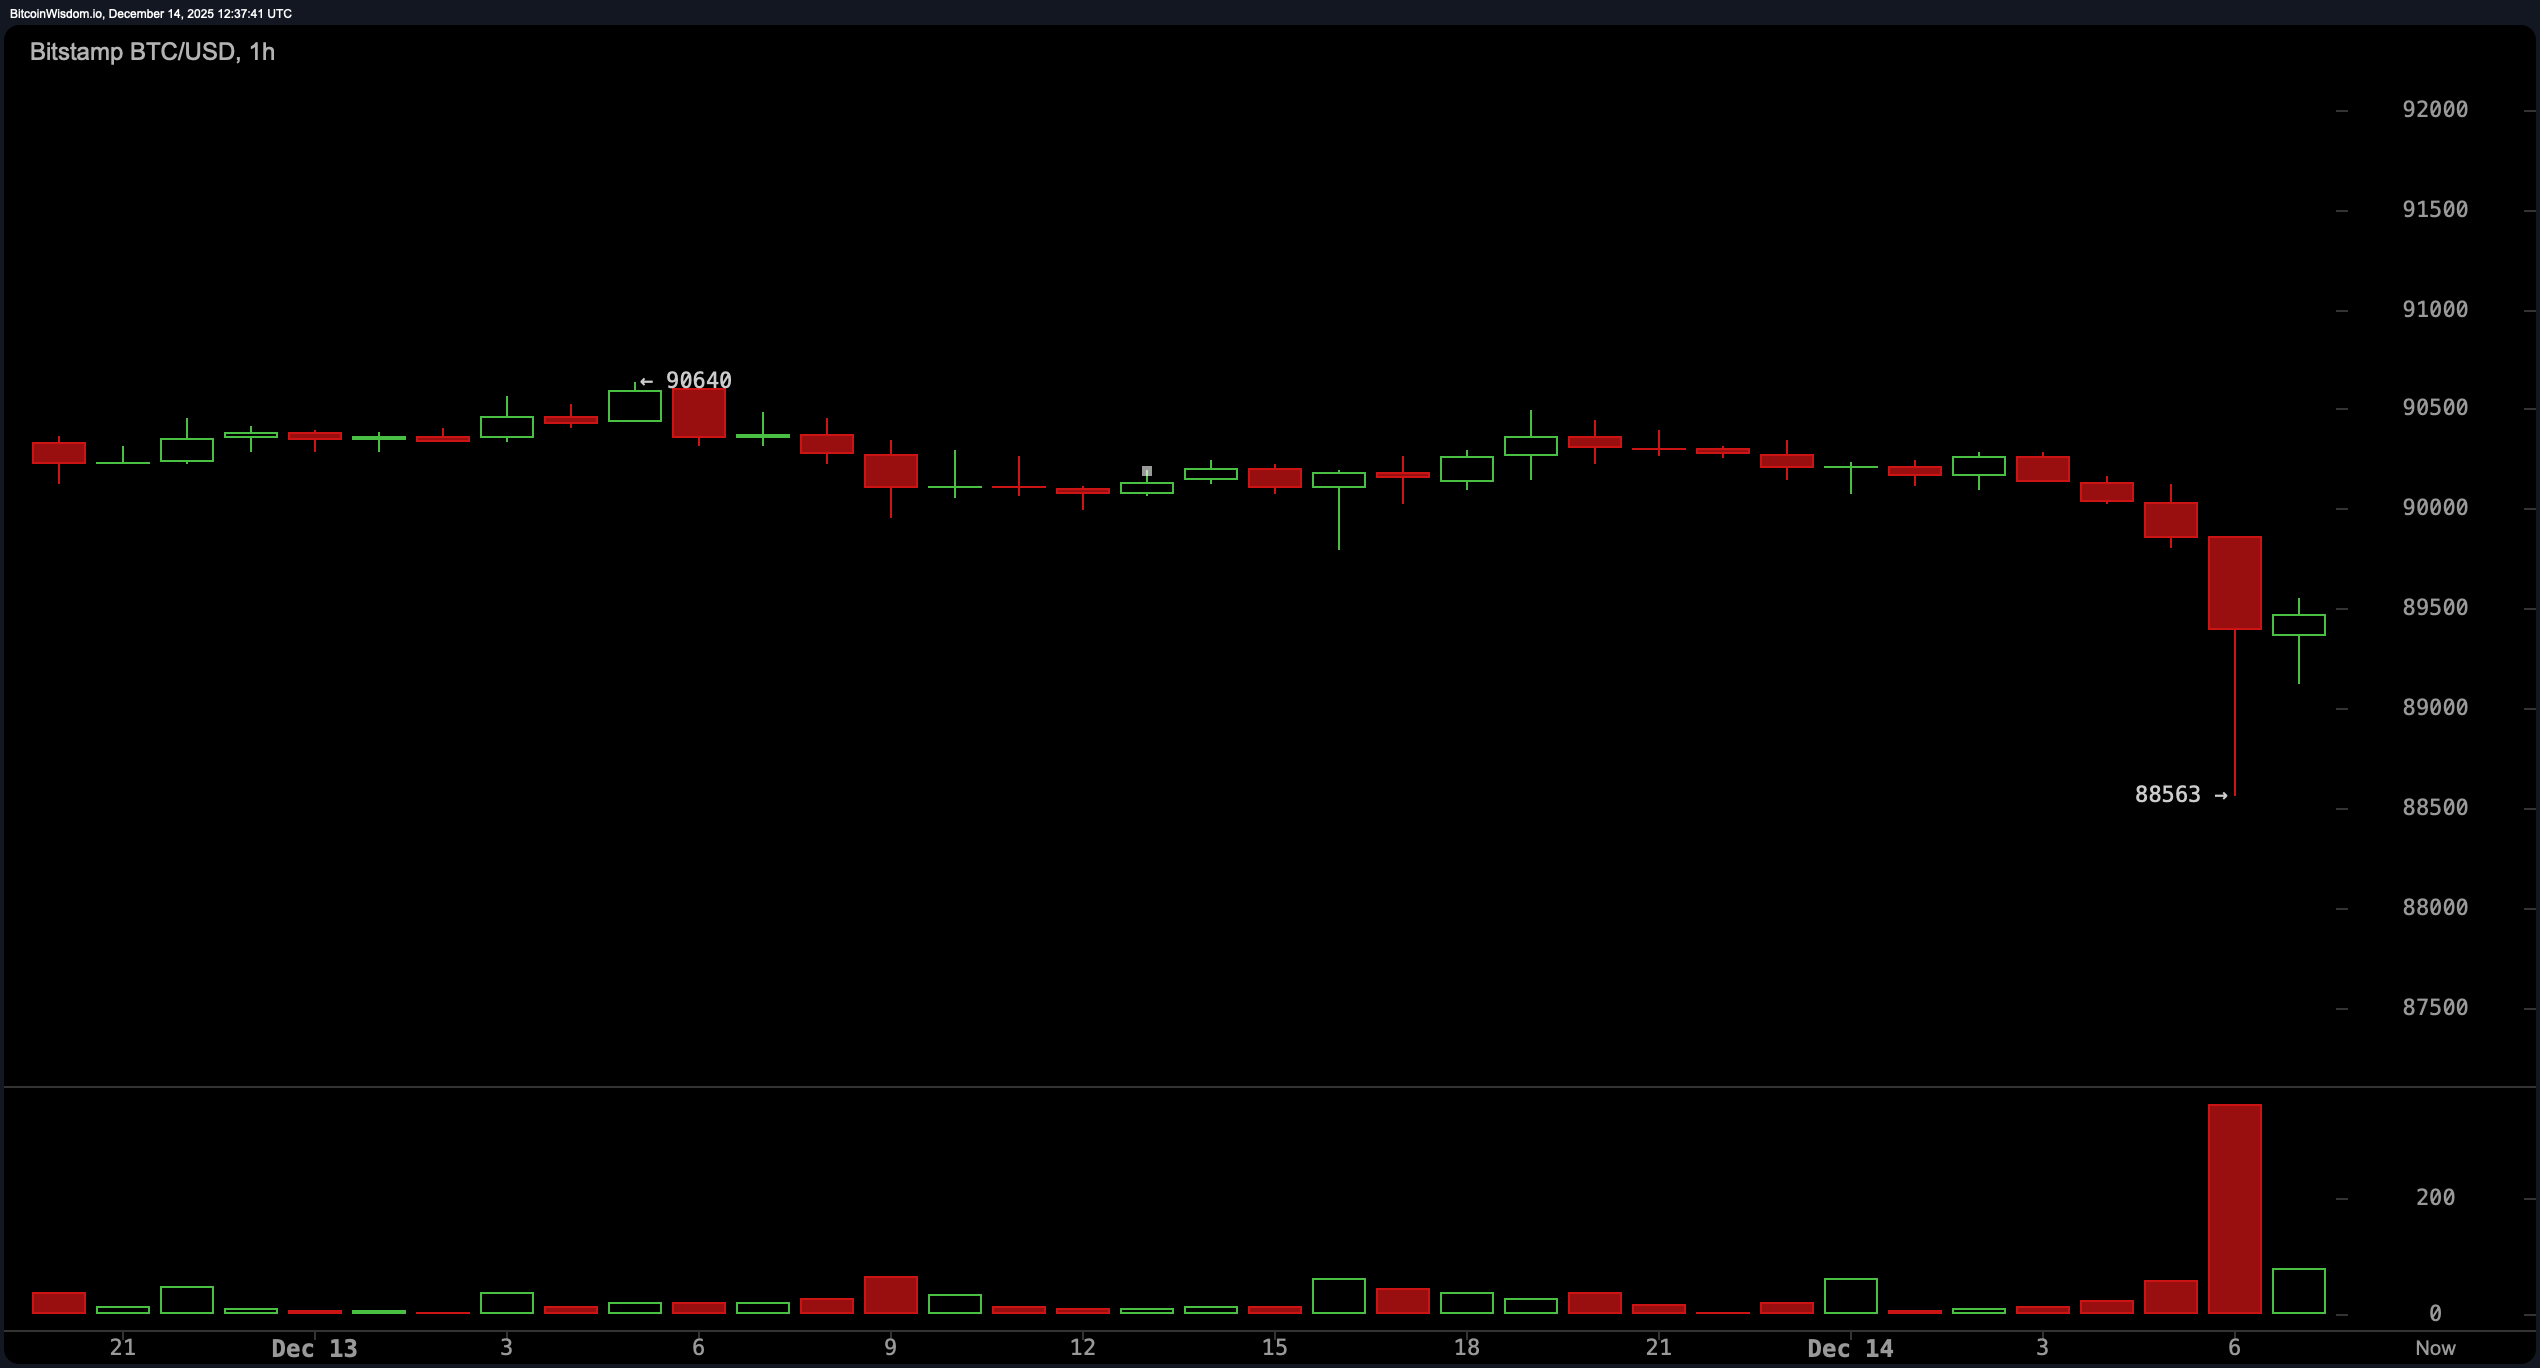
BTC/USD 1-hour chart via Bitstamp on Dec. 14, 2025.
If we expand our view to the 4-hour chart perspective we can observe lingering effects from a bearish breakdown after sideways trading activity. A significant red candle followed by an uncertain green one indicates market indecision—a classic sign that traders are unsure whether to react negatively or positively. Support was maintained at around $88,563 with some minor bounce back; however prices remain stagnant within the range of approximately $89K–$90K where resistance at about $90600 looms like an imposing figure guarding entry into bullish territory unless accompanied by substantial volume and clear bullish patterns.
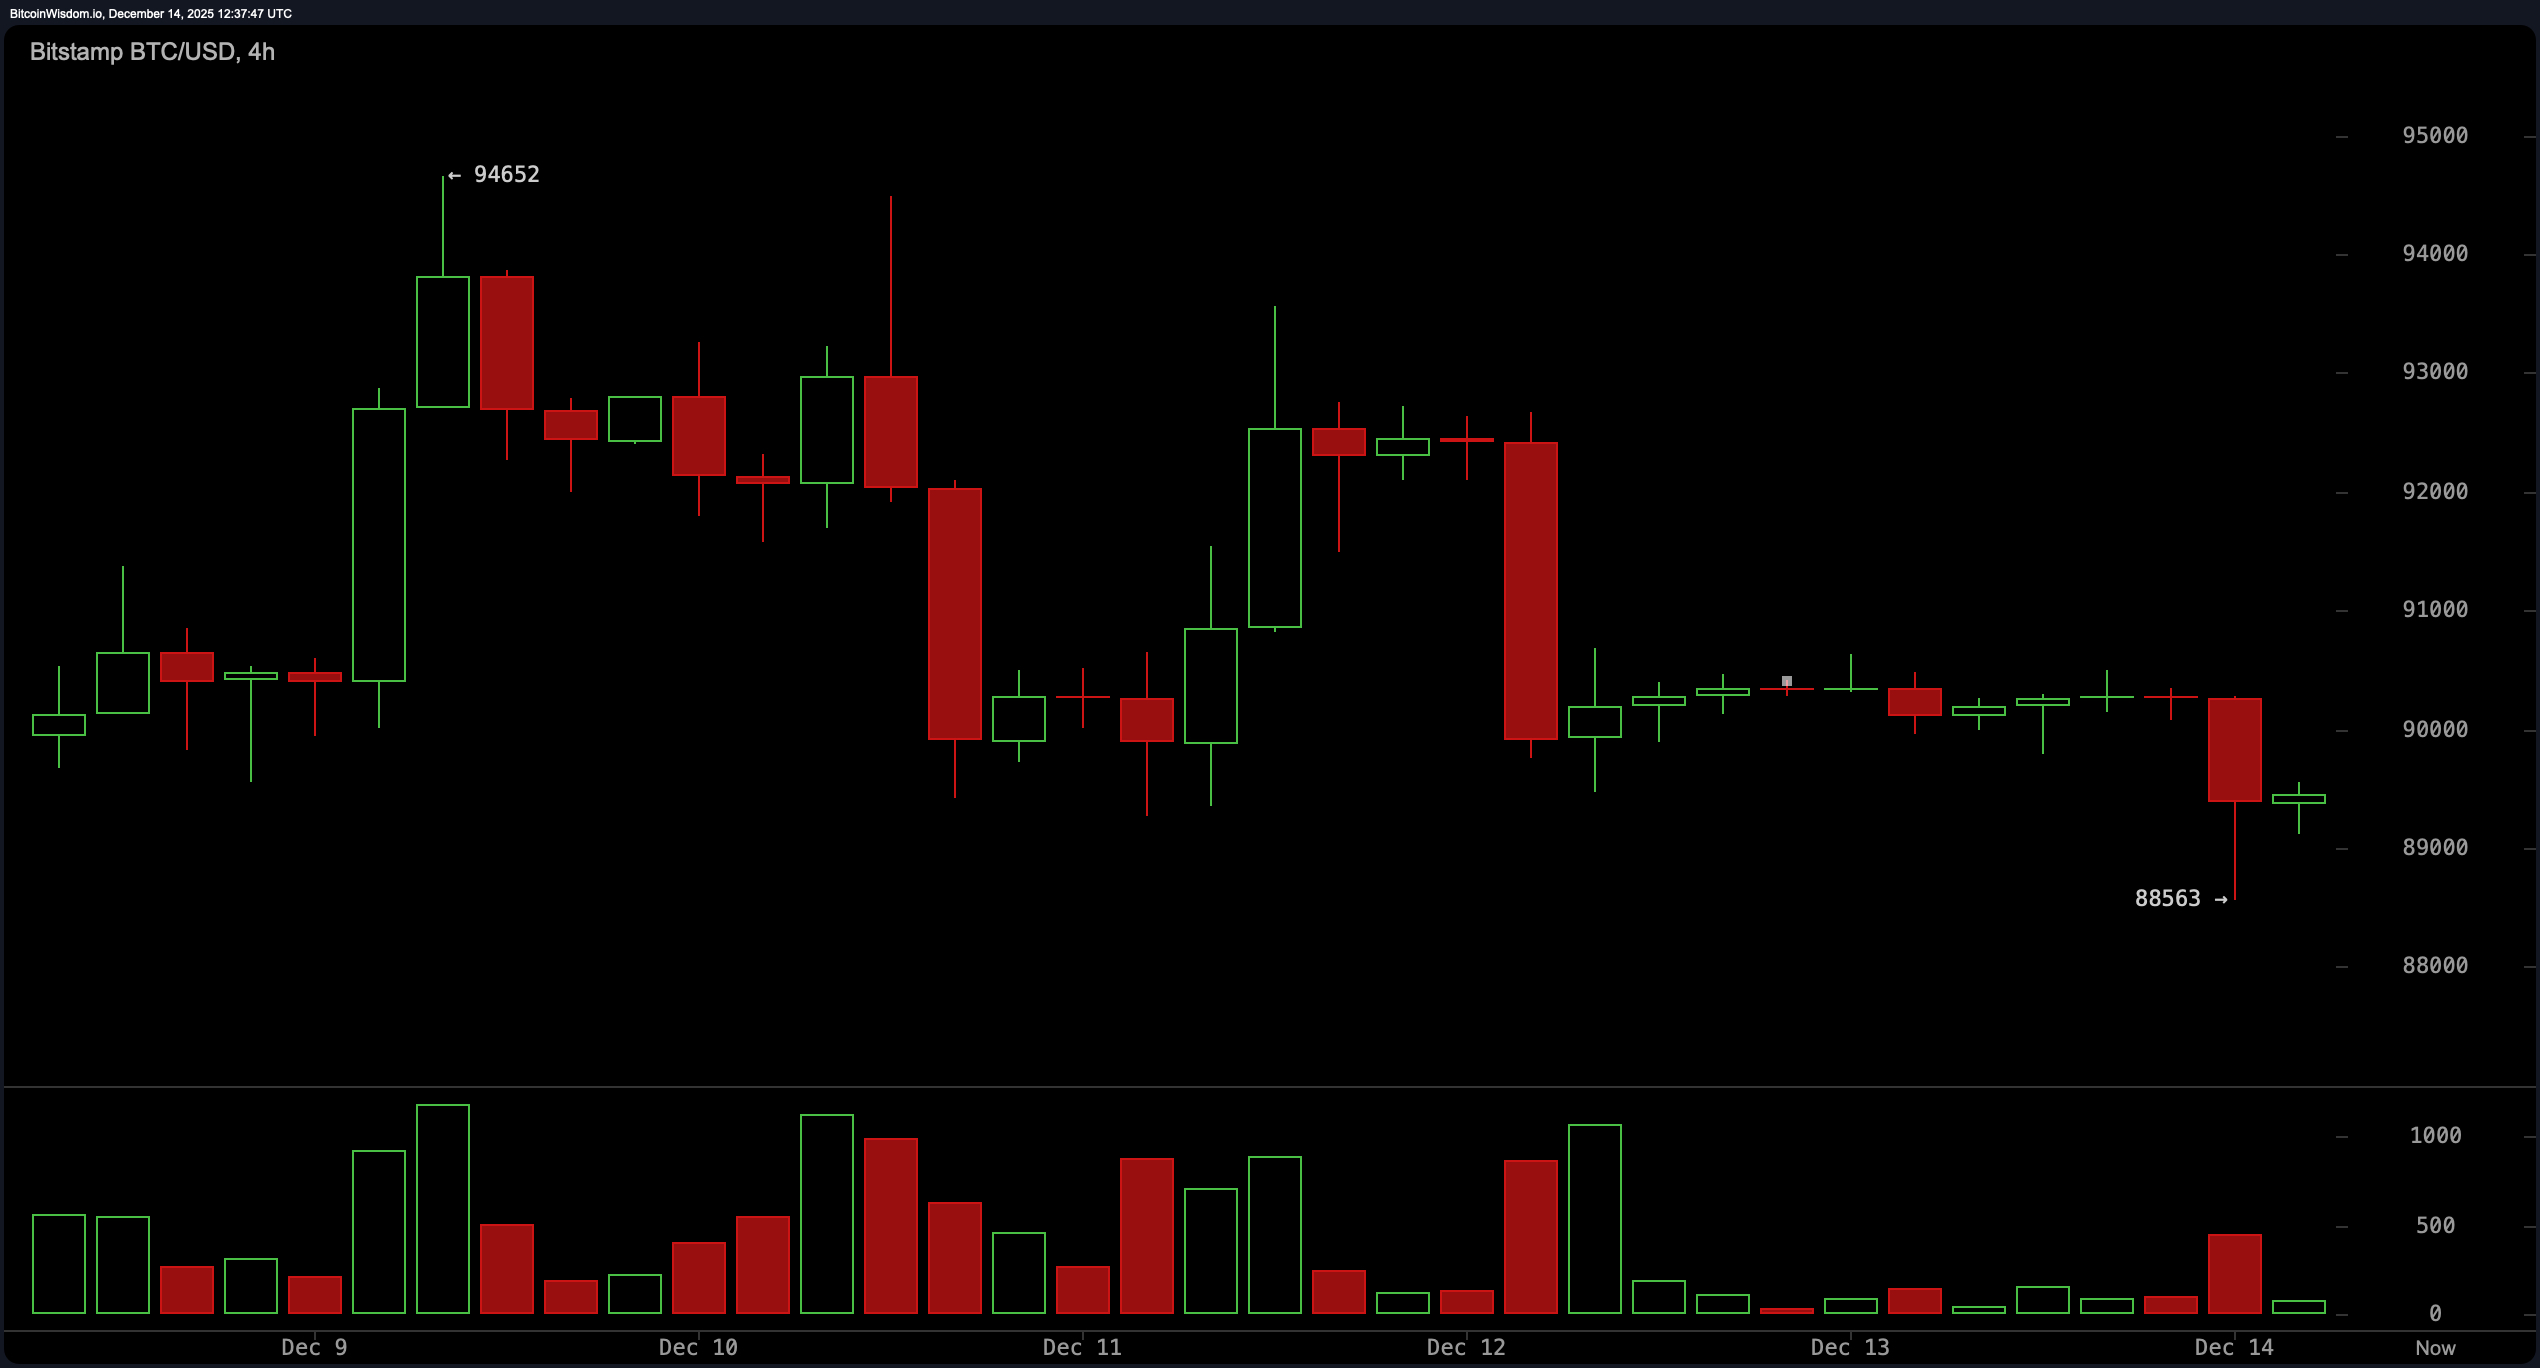
BTC/USD 4-hour chart via Bitstamp on Dec. 14,2025.
The daily charts continue narrating a bearish tale as Bitcoin has been gradually declining since reaching near its peak at around $107465。Attempts to breach through the $94K-$95K zone have consistently been thwarted。A recent bounce off the level close to $80k was met with notable increases in trade volumes which could indicate dip buying or simply bears covering their positions due exhaustion。Regardless,Bitcoin now finds itself trapped beneath familiar resistance levels,consolidating amid selling pressure while desperately needing stronger momentum for any potential reversal。
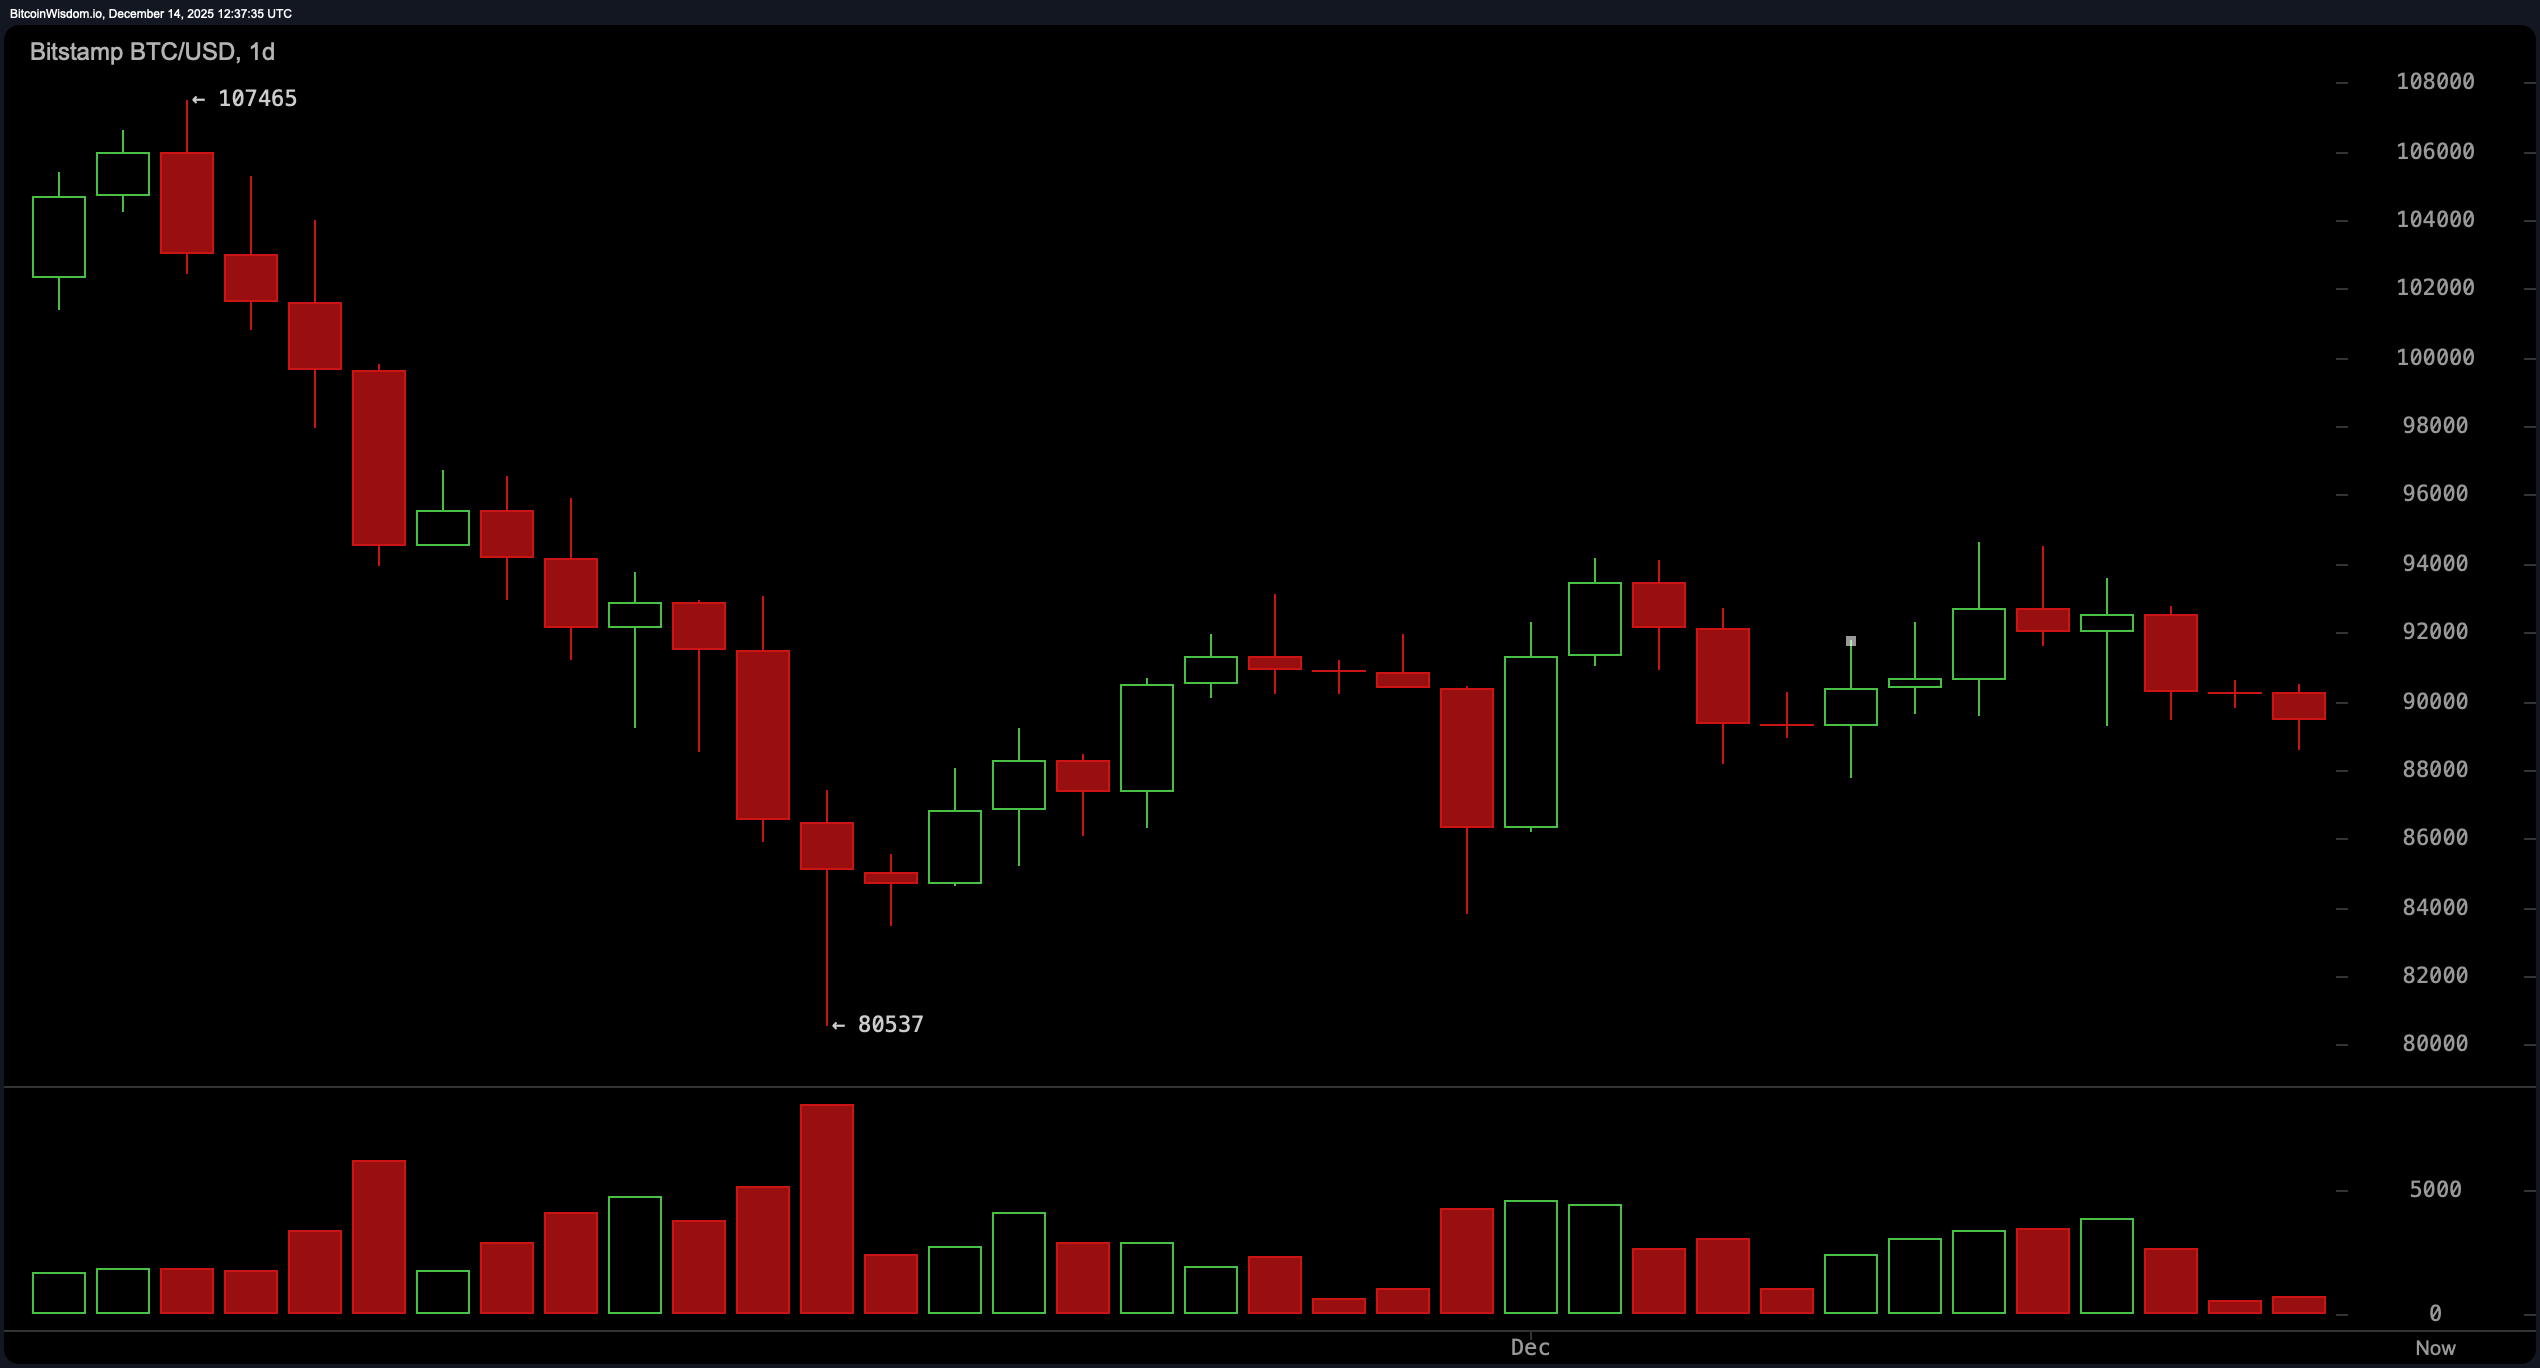
BTC/USD daily chart via Bitstamp on Dec.14,2025.
Now let’s discuss indicators because fluctuations aren’t limited solely to price movements alone.Oscillators seem neutral across various metrics—the relative strength index (RSI) stands at 43;the Stochastic oscillator reads 57;and commodity channel index (CCI) dipped downwards towards -55.The average directional index (ADX) rests calmly at26 suggesting weak trends overall.The Awesome oscillator currently sits negative (-509), indicating slight bearish sentiment but both momentum indicator (-2643) along with MACD level (-1274) appear quietly diverging away from pure pessimism hinting perhaps someone out there still holds onto hope!
As far as moving averages go? They don’t inspire much confidence either! Each one—from short-term10-period exponential moving average(EMA)(currently sittingat$90690)to long-term200-period simple moving average(SMA)(hoveringaround108575)—is flashing warning signals.All these combined bearishly aligned across different timeframes paint quite dismal picture! Unless bitcoin decisively reclaims above91000with sufficientvolume,bears will continue controlling narrative here!
In conclusion,Bitcoin’s latest performance showcases price stabilization between89000-90000range oscillators being conservative whilemovingaveragesremain unimpressed.A breakthrough above90600could alter course entirely whereas slipping below88500might lead us revisiting80850-82000support zones.Get ready—the next48hours might prove more exhilarating than DeFi hacks during launch days!
Bullish Outlook:
If Bitcoin manages not only reclaim but also maintain position over90600resistance backed upby convincingvolume then pathway towards94000-95000region opens up.Buyers seem eager lurking beneath890000mark should momentum align this could transform into recovery leg targeting higher resistances ahead!
Bearish Outlook:
A failure regaining90606leaves doors wide open retesting88505support—or worse sliding down toward805005-820002zones.Withmovingaverages leaning heavilybearishalongsideunderwhelmingmomentum downside risks remain very real indeed!
Frequently Asked Questions ❓
What is bitcoin’s current price on December 14th ,2025? Bitcoin trades today standing firmat89417
Isbitcoinbullishorbearishrightnow? Currently showingneutral-to-bearishtendenciesacrossmultipletimeframes
What key supportandresistancelevelsarecriticalforbitcoinnow?  thekeysupportsitsnear885005majorresistancesittingaround906006&940004
Whatdo technicalindicatorssuggestforbitcoin’snextmove? Indicatorsappear mixedoscillatorsremainneutralwhilemovingaveragessignalcontinuedweakness