
US stocks and home prices hit record highs in dollar terms, but they’ve dropped significantly when priced in Bitcoin.
Bitcoin has seen a steady upward trajectory over the past seven days. Starting from around $114,000 this month, it peaked at over $126,000 yesterday, October 6, before dipping slightly to hover around $123,000.
This price action comes at a time when Bitcoin and gold continue to outperform traditional assets such as real estate, according to a chart shared by Phil Rosen, co-founder of Opening Bell Daily.
This concept refers to the devaluation of traditional assets like US stocks and real estate when measured in hard assets like gold or Bitcoin. While US stocks and home prices have hit record highs in dollar terms, they’ve experienced significant losses when priced in alternative currencies such as Bitcoin.
According to Rosen’s chart, since 2020, US home prices have surged by over 50% in dollar terms, as shown by the Case-Shiller Home Price Index.
However, when those same homes are priced in Bitcoin, their value has plummeted by 90%. Notably, the discrepancy shows the growing erosion of purchasing power of the US dollar and the increasing dominance of alternative stores of value.
Essentially, the trend confirms that traditional assets may not be as strong as they appear when adjusted for the weakening purchasing power of the dollar.
S&P 500 Performance in Bitcoin Terms
Looking at a separate chart by Rosen, the S&P 500 follows a similar trajectory, showing strong gains in dollar terms but significant losses when measured in Bitcoin.
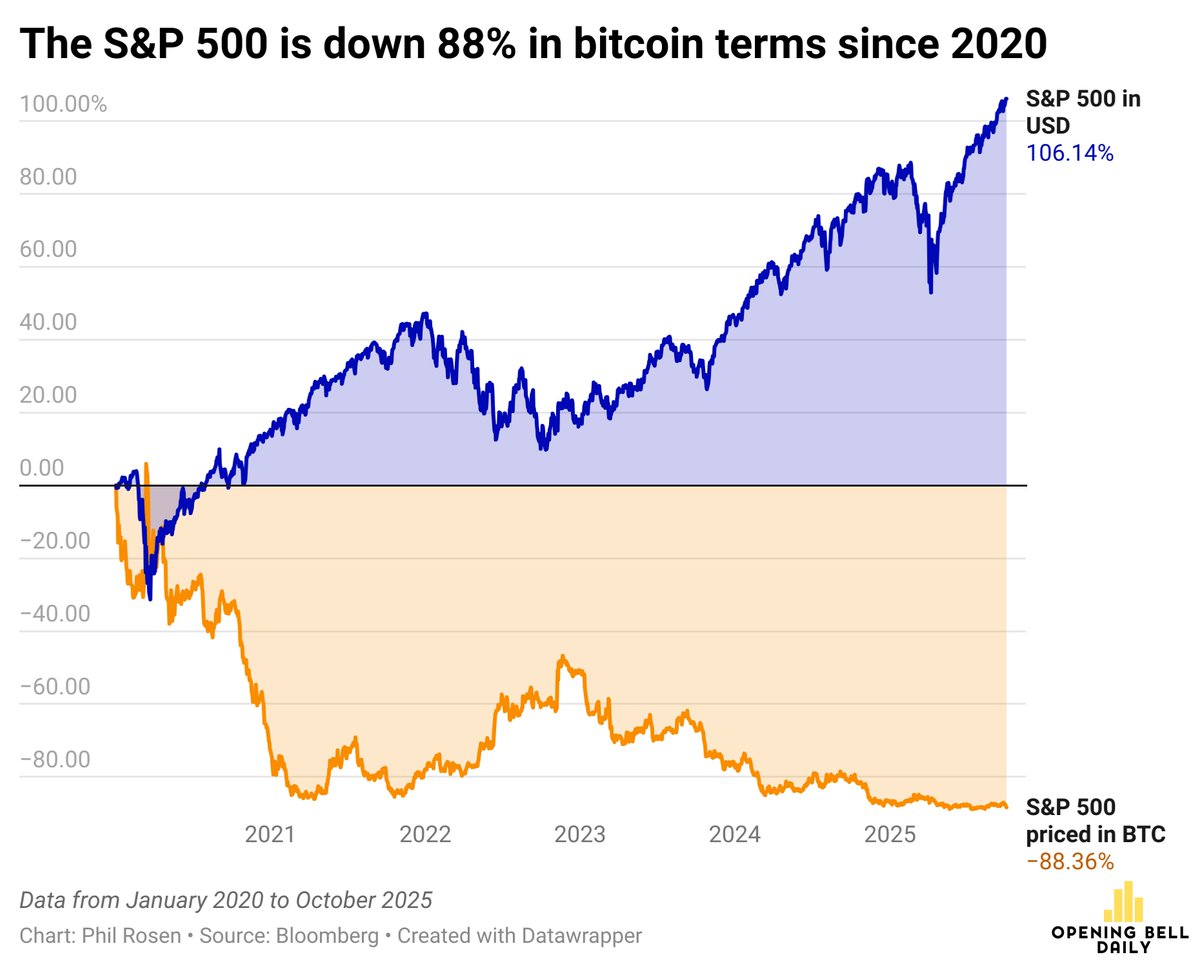
The chart shows a 106.14% gain in the S&P 500 when measured in US dollars, proving a strong performance of US equities in traditional terms. This shows investor confidence and growth in the stock market over the past several years. In contrast, the S&P 500 has seen an 88.36% decline when priced in Bitcoin.
Bitcoin Against Gold and USD
Meanwhile, despite Bitcoin’s positive growth in recent years, it has yet to surpass its 2021 price when measured against gold. At that time, Bitcoin priced per gold share surged past 400 in GLD units. Today, it is at 342.
Speaking on this, Adam Livingstone suggested that this proves the current bull run for Bitcoin may not have even started yet, implying significant potential for further growth as it catches up to its previous high against gold.
In addition, Bitcoin’s performance in USD terms since 2020 has been nothing short of fluctuations, although in a positive trend. The price has increased by about 1,619% from January 2020, when it was trading just above $7,000, to the current price of $123,800.
Where is Bitcoin Headed Then?
Amid the outperformance, an analyst is eyeing even higher prices for Bitcoin in the coming days. Specifically, Jelle recently highlighted an important technical pattern in Bitcoin’s price chart. The chart shows Bitcoin’s price pushing toward new highs, with the previous all-time highs now acting as a key support level.
This suggests that Bitcoin is undergoing a bullish trend where past resistance levels are now being retested and held as support. Such levels include $108,500 and $115,500. If these support levels hold, Bitcoin could continue its upward momentum, potentially reaching newer highs in the near term.