
In April, Bitcoin has been on a recovery path from its lows in March, briefly surpassing the $79,000 mark. However, skepticism looms over this rebound as some analysts argue that it may merely represent a mid-bear-market rally preceding a more significant correction.
One such analyst had previously forecasted a peak for Bitcoin in July 2025. Now, this same expert is assessing how much further the price of Bitcoin might decline before reaching an actual bottom.
Analyst Utilizes Previous Top Model to Forecast Bitcoin Bottom
The crypto analyst known as Killa made an impressive cycle-top prediction of $121,362 back in June 2025. This estimate came months ahead of Bitcoin achieving its all-time high of $126,100 in October 2025 and was only off by approximately 3.9%. Utilizing the same analytical model that informed his earlier prediction, Killa is now applying it to forecast potential declines.
The foundation of this projection rests on the observation that each successive market cycle for Bitcoin yields a smaller multiple compared to the previous cycle’s bottom—indicative of asset maturation. His analysis across five cycles reveals that the high-to-bottom multiple has decreased from 15.50x during the first cycle down to figures like 7.64x and then further down to around 4.47x during Cycle Four when Bitcoin peaked at $69,800 before hitting a low at $15,600.
By applying this trend of reduction moving forward, Killa estimates that the current cycle’s multiple could settle at around 3.25x; dividing this into the recent top value of $126,100 leads him to project a base target bottom price near $38,800.
To accommodate for possible variances—specifically accounting for about a 5% discrepancy affecting his peak prediction—he also suggests two upside scenarios positioned at approximately $40,740 and $42,680 respectively. Even if prices were to reach these upper limits within his projections range; they would still fall significantly short compared with levels cited by some market participants who consider anything below $60K as potentially being near correction bottoms.
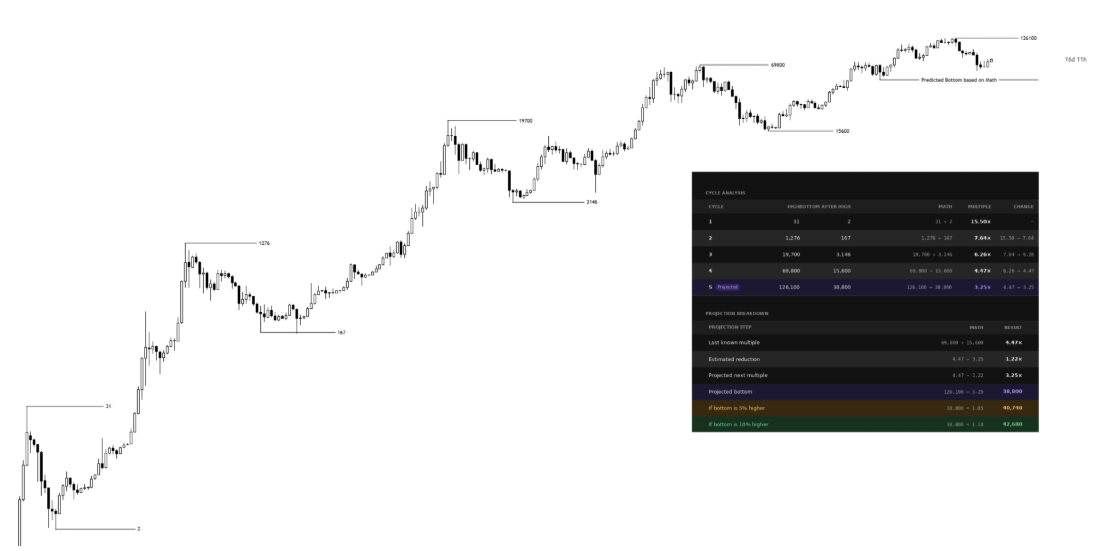
Bitcoin Price Chart Source: @KillaXBT On X
As it stands currently with prices hovering around $78 thousand dollars; reaching up towards those higher thresholds mentioned would necessitate declines nearing about 45%, while dropping closer toward $38 thousand represents nearly half-off current valuations altogether!
A Pattern Of Three Years Up Followed By One Year Down
Killa’s projected bottom finds corroboration through another analysis conducted by CryptoBullet who approached identifying bottoms via symmetry principles instead.
CryptoBullet’s weekly chart illustrates what he characterizes as five-wave Elliott Wave advances commencing late last year (2022) culminating with wave five concluding roughly near those peaks recorded above $126,000 seen back again just recently (October ’25). The subsequent corrective phase—which he denotes using W-X-Y structures depicted here in blue—is expected eventually pushing final leg downward beyond thresholds set below $50k heading towards possibly even lower targets between (45-50) thousands dollars too!
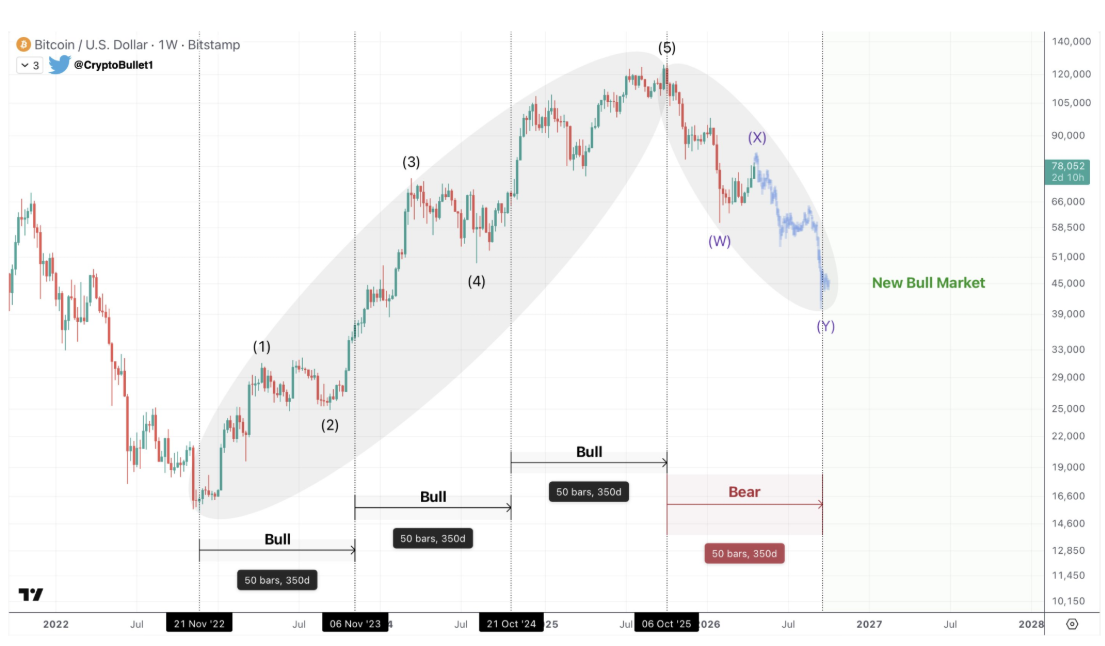
Bitcoin Weekly Chart Source:@CryptoBullet1 On X
According To This Analyst Three Consecutive Years Of Rising Prices From November ’22 Through Peaks Seen In Early ’25 Cannot Be Reasonably Corrected Within A Single Year Decline Phase . The Current Bear Market Is Expected To Extend Into Second Half Of Twenty-Sixteen Before Completion Occurs For Any Bottom Structure Formations .
This article features images sourced from Unsplash along with charts provided courtesy TradingView
FAQ:
- What is EAT?: EAT stands for Expertise-Authoritativeness-Trustworthiness which are essential criteria used by Google when evaluating content quality online.
- If I invest now will I lose money?: As always investing carries risks especially given volatile markets like cryptocurrency so one should conduct thorough research or consult financial advisors prior making decisions regarding investments!
- How often does bitcoin experience corrections? : Historically speaking , bitcoin tends toward experiencing periodic corrections following substantial upward movements typically ranging anywhere between six months up until several years depending upon overall market conditions !
- Can predictions be trusted ? : While analysts utilize various methods & data points , it’s important remember no one can accurately predict future outcomes due inherent uncertainties surrounding cryptocurrencies! Always approach forecasts cautiously & do your own due diligence !