On Thursday, Bitcoin’s price experienced minimal fluctuations, trading sideways around the $78,500 mark. The presence of a short-bodied candle suggests initial market hesitation; however, the long tail associated with this base indicates that demand remains strong. Recent on-chain analytics reveal a significant shift in market sentiment towards heightened enthusiasm. FOMO (Fear of Missing Out) has returned with vigor as investors rally in anticipation of an imminent breakout.
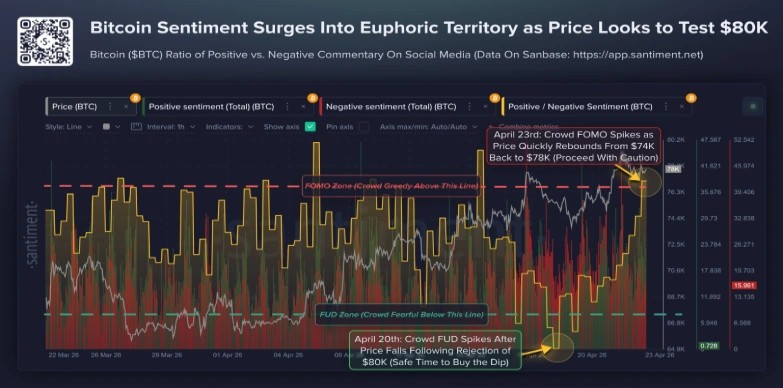
$BTC Transitions from FUD to FOMO
Over the past three weeks, Bitcoin’s price surged from $64,950 to its current value of $78,375—a remarkable increase of 20%. This rise has propelled the asset’s market capitalization to approximately $1.56 trillion. A key driver behind this upward movement was the easing geopolitical tensions following a temporary ceasefire agreement among the U.S., Iran, and Israel.
The Bitcoin marketplace is currently navigating through a volatile landscape characterized by stalled geopolitical discussions and rapidly shifting investor sentiments. Following a rejection at $80,000 earlier this week, prices fell into a phase dominated by “Fear, Uncertainty and Doubt” (FUD). Historically speaking, such bearish trends often present strategic buying opportunities before leading to swift recoveries.
By Thursday afternoon, sentiment had dramatically shifted as prices rebounded toward $78,700 igniting waves of FOMO among retail traders. Although nearing the critical resistance level at $80K could signal an impending surge higher for Bitcoin prices; data indicates that investor sentiment is reaching levels typically seen at local peaks.
Market dynamics frequently defy expectations; thus analysts are closely monitoring whether this wave of optimism can be sustained or if it will undergo correction before embarking on another ascent towards new highs.
Bitcoin Price Faces Bear Flag Pattern for Potential Bullish Breakout
As per recent updates at press time; Bitcoin is trading at approximately $78,220 reflecting an intraday gain of 0.08%. Earlier today sellers attempted to push for another correction but showed notable resilience against downward pressure.
The long-tail rejection seen in today’s candlestick signifies persistent demand above the crucial threshold of $77K for $BTC. Should bullish momentum continue unabated; buyers may challenge overhead resistance posed by inverted flag patterns visible on daily charts.
A successful breakout beyond these barriers could amplify buying pressure pushing Bitcoin’s price up towards targets like $83K followed closely by aspirations reaching up to around $90K.
The momentum indicator RSI rising back up to 64% reinforces signs indicating renewed bullish activity within pricing structures.
This chart setup illustrates an initial decline followed by temporary relief rallies aimed at regaining lost bearish momentum during previous downtrends.
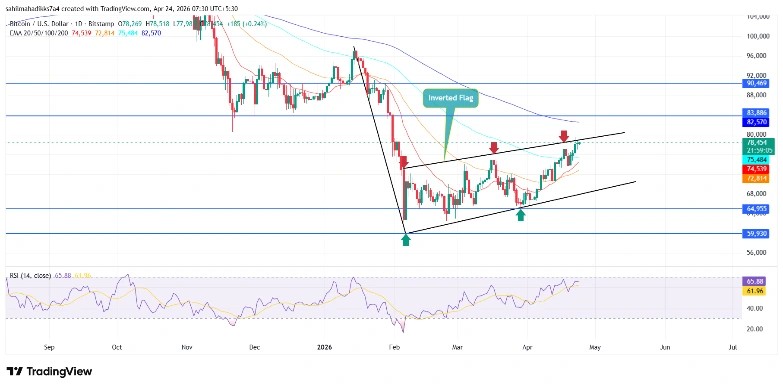
If however overhead resistance remains unbroken then we might see potential declines where bitcoin could drop as much as 10% downwards hitting around$70k prior attempting any support challenges beneath flag patterns
A breakdown below these supports would likely extend corrections further potentially reaching lows near$60k level .